
J League 2024: Team Playing Styles Analysis
Introduction
The 2024 J League season consists of 38 game weeks, with each game week featuring 10 matches, except for the final game week (38th), which includes only six matches. In total, the league encompasses 376 competitive fixtures, providing a comprehensive dataset for analyzing team playing styles and tactical approaches.
The following 20 teams are competing in the 2024 J League season:
- Kashima Antlers
- FC Machida Zelvia
- Urawa Reds
- Albirex Niigata
- Gamba Osaka
- Sanfrecce Hiroshima
- Tokyo
- Cerezo Osaka
- Yokohama F. Marinos
- Nagoya Grampus
- Kyoto Sanga FC
- Kashiwa Reysol
- Vissel Kobe
- Sagan Tosu
- Kawasaki Frontale
- Avispa Fukuoka
- Tokyo Verdy
- Júbile Iwata
- Consadole Sapporo
- Shonan Bellmare
Key Performance Metrics
To analyze team playing styles, we have calculated the following advanced performance metrics:
Possession and Ball Movement Metrics
- Possession (%) – Measures the percentage of time a team controls the ball in a match.
- Maintain (%) – Represents ball control within a team’s own half during a possession chain.
- Buildup (%) – Measures ball control within 50%-84% of the pitch during a possession chain.
- Sustain (%) – Represents ball control beyond 75% of the pitch in a possession chain.
- Passes per Sequence – The average number of passes played during a single possession sequence.
- Attacking Passes per Sequence – The number of passes in a sequence that results in a shot.
- Speed (meters/sec.) – The speed of ball movement during a possession sequence.
- Direct Speed Upfield (meters/sec.) – The average speed of ball progression towards the opponent’s goal.
- Verticality – The ratio of forward progression to total pass distance, representing the directness of ball movement towards opponent’s goal.
- Field Tilt – The proportion of a team’s final third passes compared to the total number of final third passes between both teams, indicating territorial dominance.
Defensive and Pressing Metrics
- PPDA (Passes Allowed Per Defensive Action) – Measures pressing intensity by calculating the number of passes allowed beyond the 40m mark before a defensive action is made.
- Defensive Action Height (meters) – The average field position where a team performs defensive actions.
- Pressure – The number of times an opponent team applied pressure on the team in possession.
- High Turnovers – The number of times a team won possession in open play above 60% of the pitch (within forty metres of the opponent’s pitch).
Attacking and Transition Metrics
15. Buildup Attack – The number of open-play sequences consisting of 10+ passes that either result in a shot or include at least one touch inside the opponent’s penalty box.
- Direct Attack – Open-play sequences that start inside a team’s own half, move at least 50% toward the opponent’s goal, and end in a shot or a penalty box touch.
- Direct Attack (Less than 10 Passes) – A variation of Direct Attack where the sequence is completed in fewer than 10 passes.
- Ball Progression – Defined as significant forward passes with a minimum forward movement of 10m. and a minimum total distance of 15m.
These metrics provide deep insights into how teams approach both build-up play and defensive structures, enabling a data-driven understanding of playing styles in the 2024 J League season.
The analysis aims to highlight variations in team strategies, categorize their tactical approaches, and identify the strengths and weaknesses of individual teams based on empirical evidence.
The analysis is structured into three distinct parts, each offering valuable insights into J League 2024 team strategies and individual team performance.
The first part delves into the playing styles of all participating teams, analyzing key tactical elements such as possession control, pressing intensity, and attacking patterns. Through various performance metrics and visualizations, this section highlights how teams navigate transitions, defend spaces, and create scoring opportunities, revealing the diverse tactical identities across the league.
The second part shifts focus to a comprehensive case study of Kashiwa Reysol, exploring their tactical approach, strengths, and areas for improvement. This section compares Kashiwa Reysol’s style and performance with their peers, offering a deeper understanding of their successes and struggles throughout the season.
The third part expands the analysis to Ball Progression and Pressure Application by Zones, providing insights into how teams advance the ball through flanks, half-spaces, or central space and how they apply defensive pressure in these areas. Additionally, this section includes visualizations of goalkeeper ball distribution by zones, offering a tactical perspective on buildup patterns from the back. Finally, it presents an in-depth look at shot selection, xG (expected goals), and goal-scoring zones, uncovering trends in finishing efficiency and attacking effectiveness across the league.
Part – 1: Playing Style Aspects
- Average Direct Speed Upfield (m/s) vs. Average Passes Per Sequence: Highlights tactical diversity, revealing how teams balance possession control and attacking transitions.
- Average Speed vs. Average Direct Speed Upfield (m/s): Captures the pace of ball circulation and vertical progression tendencies and how teams balance tempo.
- Average Possession vs. Average Number of Out-of-Possession (OOP) Pressures: Demonstrates how possession control correlates with OOP pressure, and more of representation of how teams balance defensive pressing and ball control.
- PPDA vs. Field Tilt: Measures pressing intensity alongside territorial dominance high up on the Pitch, offering insights into defensive and positional strategies and more of pressing efficiency and ability to control play in advanced areas.
- Buildup Attacks vs. Direct Attacks (with less than 10 passes): Compares patient buildup play with quick, direct offensive transitions.
- Buildup Attacks vs. Direct Attacks: Contrasts structured possession play with direct, vertical attacking patterns.
- Average Verticality vs. Average Defensive Action Height (meters): Connects direct ball progression with defensive positioning, team tendencies regarding defensive positioning and ball progression. High Verticality (i.e., Direct Ball Progression towards Opponent’s Goal), Low Verticality (i.e., move the ball sideways)
- Average Turnover vs. Average PPDA: Measures how high pressing intensity translates to turnovers, offering a deeper understanding of each team’s defensive strategy.
- PCA-Based Clustering Method: Groups teams based on multiple playing style dimensions, revealing clusters of teams with similar tactical profiles and patterns.
Figure 1: Average Direct Speed Upfield (m/s) vs Average Passes Per Sequence
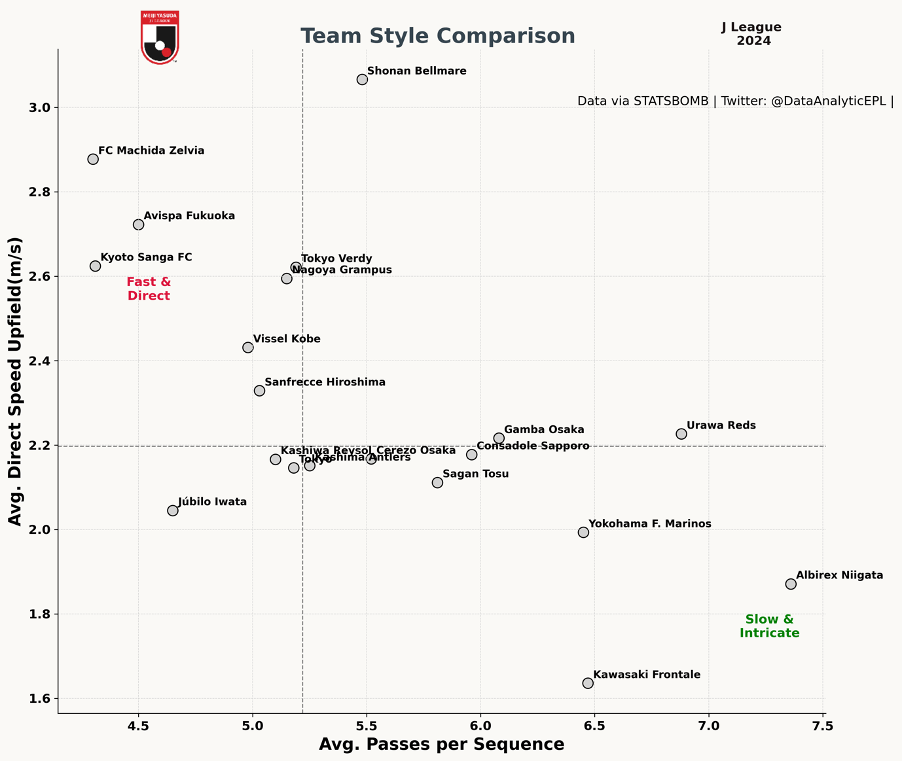
This Team Style Comparison scatter plot visualizes the playing styles of J League teams in 2024. The x-axis represents Average Passes per Sequence, indicating how many passes teams use in a possession phase, while the y-axis represents Average Direct Speed Upfield (m/s), measuring how quickly teams progress the ball towards the opponent’s goal.
- Top-left quadrant (Fast & Direct): Teams like FC Machida Zelvia, Kyoto Sanga FC, and Avispa Fukuoka exhibit a direct style, moving the ball quickly with fewer passes.
- Bottom-right quadrant (Slow & Intricate): Teams such as Albirex Niigata and Kawasaki Frontale prioritize a patient build-up with many passes per sequence.
- Top-right quadrant (Balanced Approach): Teams like Urawa Reds blend both styles, using a high number of passes while maintaining a decent direct speed.
- Bottom-left quadrant (Low Tempo & Direct Play): Teams like Júbilo Iwata tend to play with fewer passes and lower progression speed.
Figure 2: Average Speed vs Average Direct Speed Upfield (m/s)
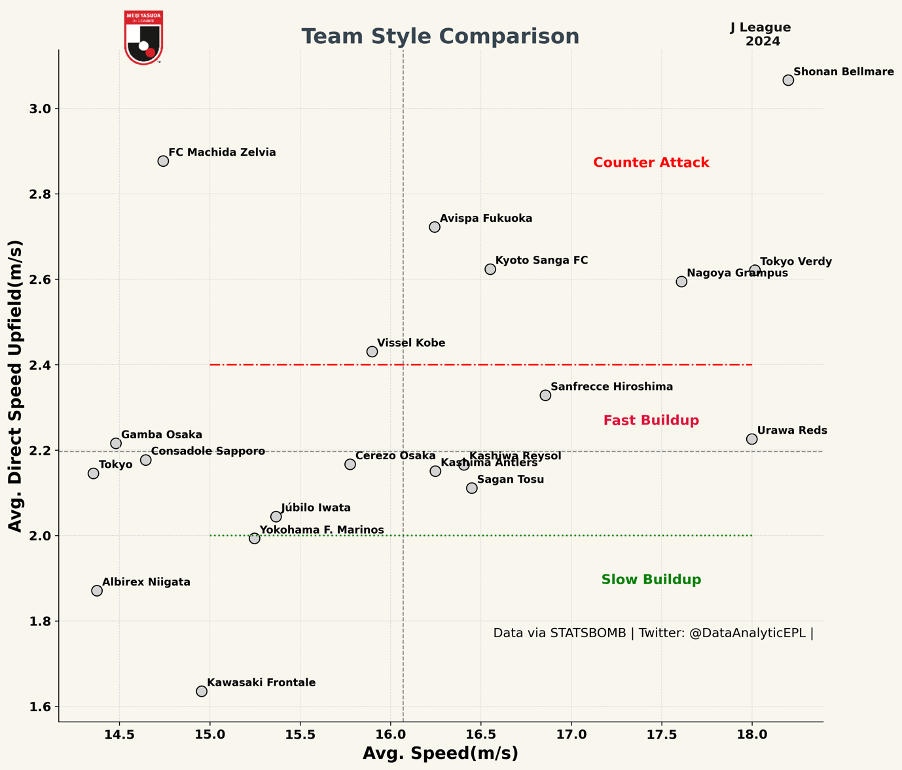
This Team Style Comparison scatter plot categorizes J League teams based on their Average Speed (m/s) on the x-axis and Average Direct Speed Upfield (m/s) on the y-axis.
- Counter-Attack Teams: Teams like Shonan Bellmare, FC Machida Zelvia, and Avispa Fukuoka exhibit a counter-attacking style, progressing the ball upfield quickly while maintaining a high overall speed of play.
- Fast Build-Up Teams: Teams such as Nagoya Grampus, Tokyo Verdy, and Urawa Reds focus on a rapid build-up style, progressing quickly upfield with a structured attacking rhythm.
- Balanced Build-Up Teams: Teams like Kashima Antlers, Sagan Tosu, and Kashiwa Reysol maintain a structured approach with moderate speed and progression.
- Slow Build-Up Teams: Teams such as Albirex Niigata and Kawasaki Frontale rely on a patient possession-based build-up, with lower speed and gradual progression.
Figure 3: Average Possession vs Average Number of Out of Possession (OOP) Pressure
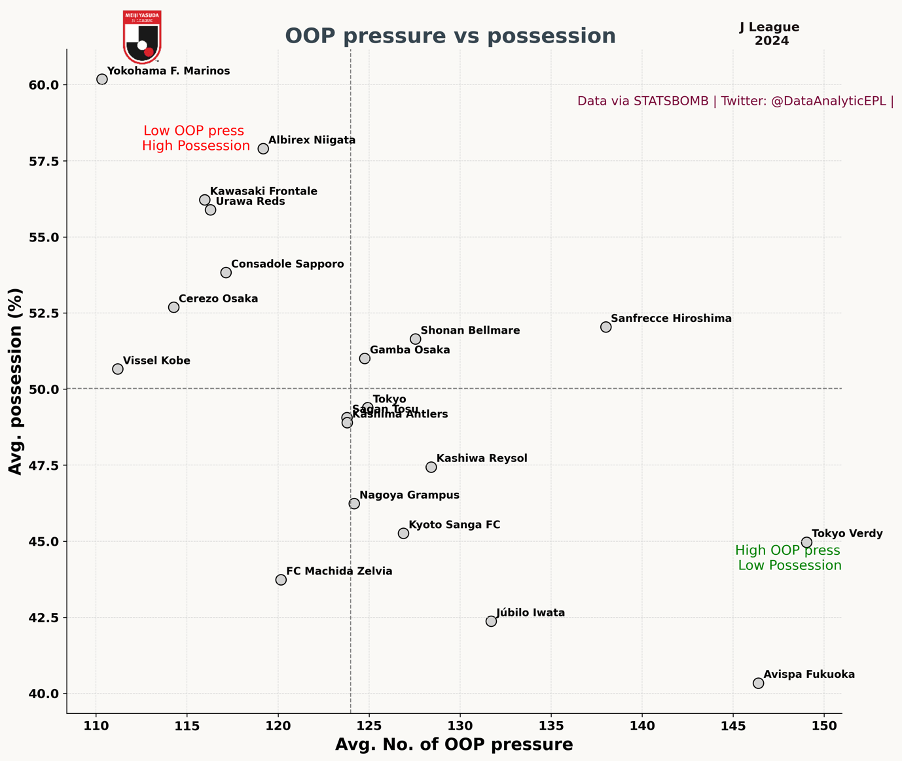
This OOP (Out of Possession) Pressure vs Possession scatter plot categorizes J League teams based on their Avg. Number of Out-of-Possession Pressures on the x-axis and Avg. Possession (%) on the y-axis.
- Top-left quadrant (Low OOP Press, High Possession): Teams like Yokohama F. Marinos and Albirex Niigata prioritize ball retention over aggressive pressing, favoring a controlled build-up approach.
- Top-right quadrant (High OOP Press, High Possession): Sanfrecce Hiroshima exhibits a high-possession, high-pressing game, engaging in active defensive actions while maintaining ball control.
- Bottom-left quadrant (Low OOP Press, Low Possession): Teams such as FC Machida Zelvia and Nagoya Grampus neither press intensely nor dominate possession, suggesting a more reactive tactical setup.
- Bottom-right quadrant (High OOP Press, Low Possession): Tokyo Verdy and Avispa Fukuoka apply high pressing intensity while maintaining low possession, indicating a counter-pressing or direct attacking strategy.
Figure 4: PPDA vs Field Tilt
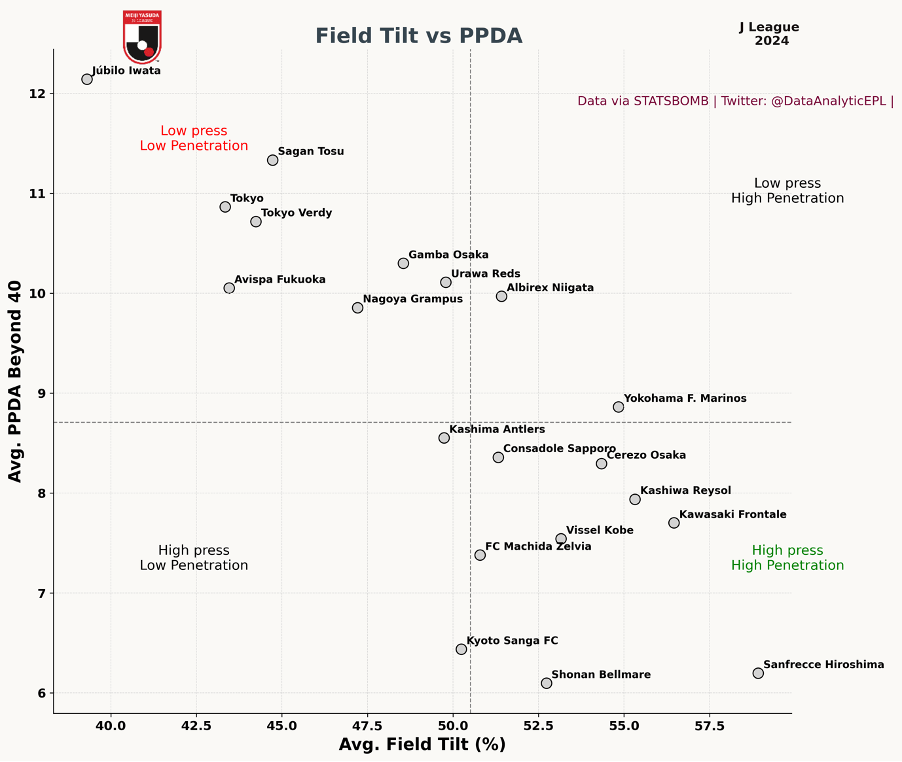
This Field Tilt vs PPDA scatter plot categorizes J League teams based on their Avg. Field Tilt (%) on the x-axis and Avg. PPDA Beyond 40m on the y-axis.
- Top-left quadrant (Low Press, Low Penetration): Teams like Júbilo Iwata, Tokyo Verdy, and Sagan Tosu apply minimal pressing and struggle to dominate possession in advanced areas.
- Top-right quadrant (Low Press, High Penetration): Yokohama F. Marinos and Albirex Niigata prioritize ball progression but do not engage in high pressing, suggesting a possession-based approach.
- Bottom-left quadrant (High Press, Low Penetration): Teams such as Kashima Antlers and Kyoto Sanga FC engage in aggressive pressing but lack final-third control, indicating a disruptive defensive setup.
- Bottom-right quadrant (High Press, High Penetration): Sanfrecce Hiroshima, Kawasaki Frontale, and Kashiwa Reysol maintain high pressing intensity while dominating territorial control, demonstrating an aggressive, front-footed playing style.
Figure 5. Buildup Attacks vs Direct Attacks (with less than 10 Passes)
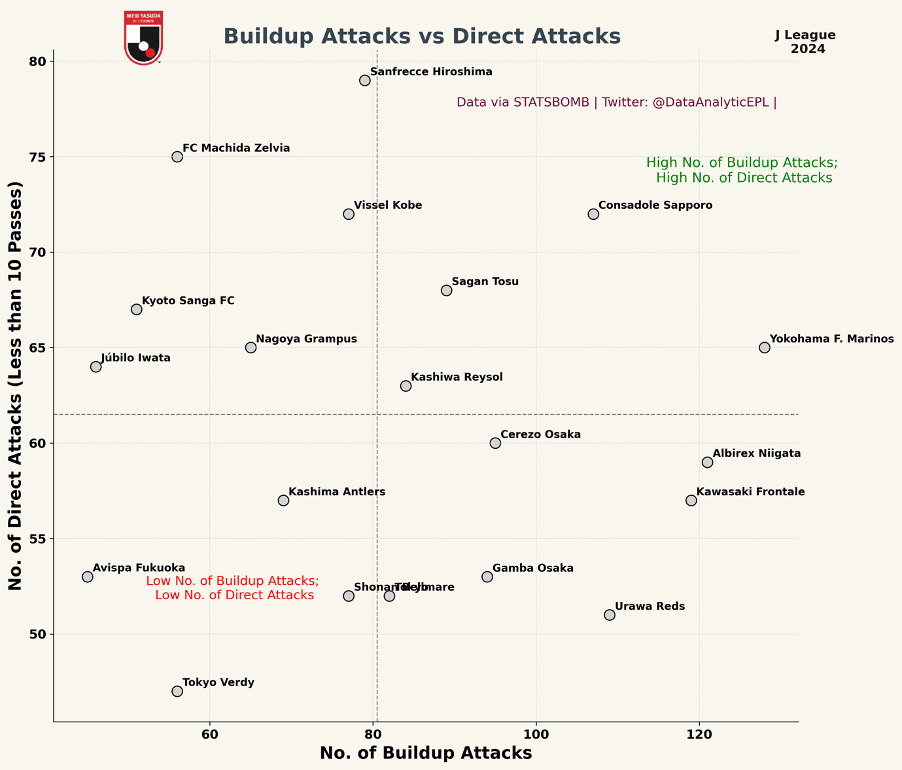
This Buildup Attacks vs Direct Attacks (Less than 10 Passes) scatter plot categorizes J League teams based on their No. of Buildup Attacks on the x-axis and No. of Direct Attacks (Less than 10 Passes) on the y-axis.
- Top-left quadrant (High Direct Attacks, Low Buildup Attacks): Teams like Sanfrecce Hiroshima and FC Machida Zelvia rely heavily on direct attacking sequences, prioritizing quick transitions over sustained possession play.
- Top-right quadrant (High Direct Attacks, High Buildup Attacks): Consadole Sapporo and Yokohama F. Marinos are balanced teams that generate both structured buildup attacks and frequent direct attacks, showcasing flexibility in their approach.
- Bottom-left quadrant (Low Direct Attacks, Low Buildup Attacks): Teams such as Tokyo Verdy and Avispa Fukuoka create fewer structured attacking sequences, indicating a lower overall attacking volume.
- Bottom-right quadrant (High Buildup Attacks, Low Direct Attacks): Kawasaki Frontale and Urawa Redsfocus on possession-based buildup play, avoiding frequent direct attacking transitions.
Figure 6. Buildup Attacks vs Direct Attacks
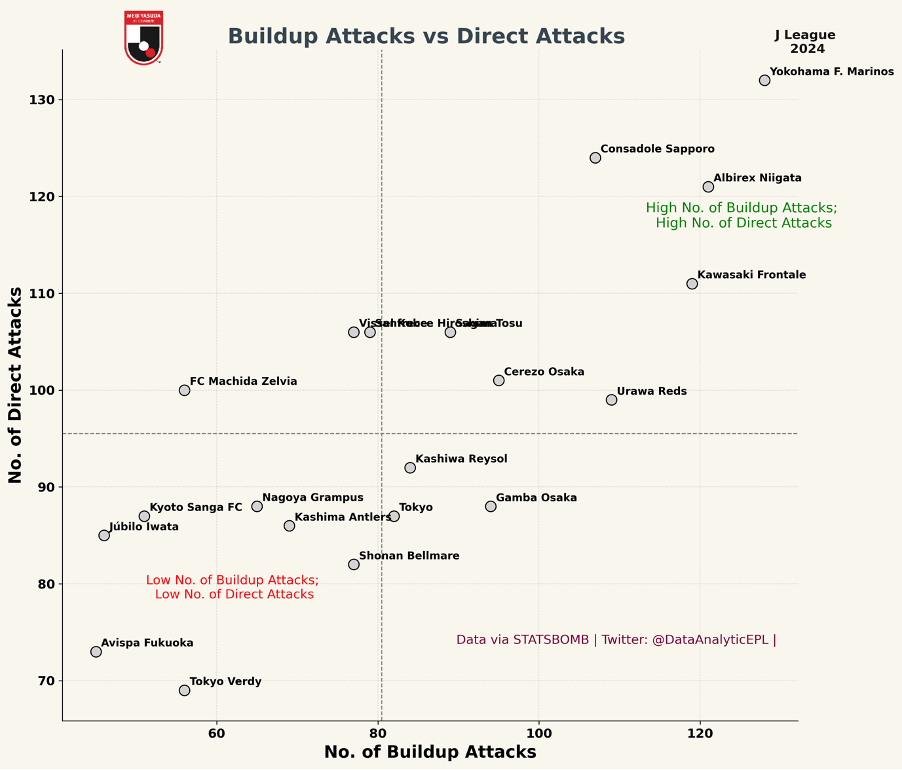
This Buildup Attacks vs Direct Attacks scatter plot categorizes J League teams based on their No. of Buildup Attacks on the x-axis and No. of Direct Attacks on the y-axis.
- Top-left quadrant (High Direct Attacks, Low Buildup Attacks): Teams like FC Machida Zelvia and Sanfrecce Hiroshima favor a direct attacking approach, prioritizing quick, vertical plays over structured buildup.
- Top-right quadrant (High Direct Attacks, High Buildup Attacks): Yokohama F. Marinos, Albirex Niigata, and Consadole Sapporo generate both high possession-based buildup sequences and frequent direct attacks, displaying a flexible offensive strategy.
- Bottom-left quadrant (Low Direct Attacks, Low Buildup Attacks): Teams such as Tokyo Verdy and Avispa Fukuoka create fewer structured attacking sequences, suggesting a more passive or defensive-oriented approach.
- Bottom-right quadrant (High Buildup Attacks, Low Direct Attacks): Kashiwa Resyol and Gamba Osaka focus on controlled possession and structured buildup play, rarely relying on direct transitions.
Figure 7. Avg. Verticality vs Avg. Defensive Action Height (m.)
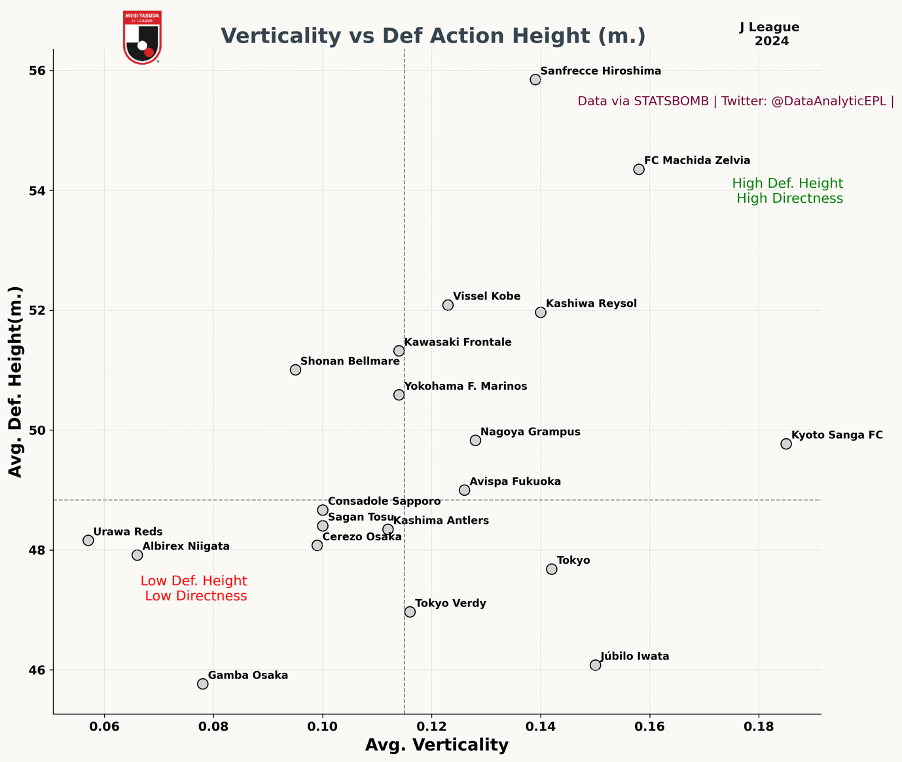
This Verticality vs Defensive Action Height scatter plot categorizes J League teams based on their Avg. Verticality on the x-axis and Avg. Defensive Action Height (m.) on the y-axis.
- Top-left quadrant (High Defensive Height, Low Directness): Teams like Shonan Bellmare maintain a high defensive line but rely less on direct attacking transitions, favouring a structured press.
- Top-right quadrant (High Defensive Height, High Directness): Sanfrecce Hiroshima and FC Machida Zelvia combine high defensive positioning with direct attacking play, indicating a proactive, aggressive approach.
- Bottom-left quadrant (Low Defensive Height, Low Directness): Teams such as Urawa Reds, Albirex Niigata, and Gamba Osaka operate with a deeper defensive line and less vertical ball progression, likely favouring possession-based buildup play.
- Bottom-right quadrant (Low Defensive Height, High Directness): Júbilo Iwata and Tokyo Verdysit deeper but use a highly direct approach, suggesting a counter-attacking focus.
Figure 8. Avg. PPDA vs Avg. Turnover
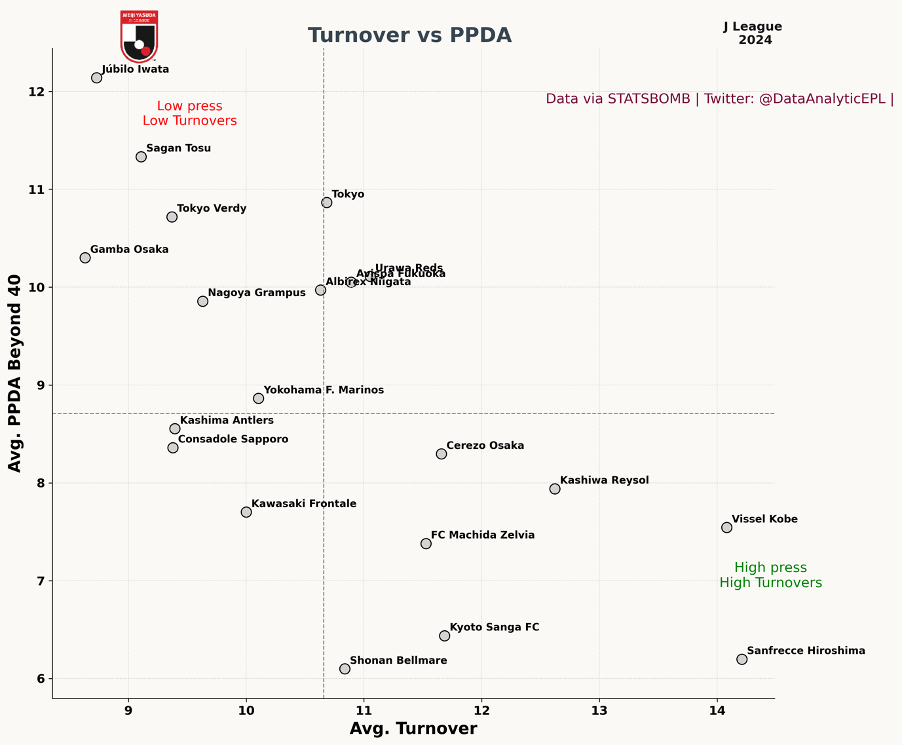
This scatter plot categorizes J League teams based on their Average Turnovers (x-axis) and Average PPDA Beyond 40m (y-axis), offering insights into their pressing intensity and ball-winning effectiveness.
- Top-left quadrant (Low Press, Low Turnover): Teams like Júbilo Iwata, Sagan Tosu, and Tokyo Verdy apply minimal pressing and create fewer turnovers, indicating a passive defensive approach.
- Bottom-right quadrant (High Press, High Turnover): Teams such as Vissel Kobe and Sanfrecce Hiroshima apply intense pressing, frequently forcing turnovers in advanced areas, aligning with their high-risk, high-reward style.
- Bottom-left quadrant (High Press, Low Turnover): Teams like Kashima Antlers and Kawasaki Frontale press aggressively and generate low number of turnovers and may struggle with ball retention or recovery structure.
- Top-right quadrant (Low Press, High Turnover): Teams like Urawa Reds and Tokyo create turnovers despite moderate pressing, suggesting a compact defensive block or transitional traps to win possession.
So far, we have tried to understand playing styles by analyzing variables such as Average Speed, Average Direct Speed (m/s), Avg. Passes per Sequence, Avg. Attacking Passes per Sequence, Avg. Defensive Height, Avg. Turnover and Avg. Verticality (Directness) against each other. This approach provides a clear picture of playing styles based on specific aspects of play, such as buildup vs. directness or defensive positioning vs. pressing intensity. However, comparing two variables in isolation fails to capture the holistic nature of a team’s playing identity.
To achieve a comprehensive classification, we need to consider all the key performance metrics simultaneously. This necessity led us to employ a PCA-based K-Means clustering approach, ensuring that team styles are grouped based on multi-dimensional similarities rather than individual attributes alone.
To categorize the playing styles of J League teams, we applied Principal Component Analysis (PCA) based K-Means clustering, using key performance indicators such as build-up attacks, direct attacks, PPDA, field tilt, possession, verticality, speed, defensive height, and pressing intensity. After scaling the data with MinMax Scaler, we identified six distinct clusters, each representing a unique approach to the game.
Cluster-Based Team Style Analysis
The visualizations present clusters of teams based on their playing style dimensions:
- Cluster 1 – Possession-Based, Slow Buildup Teams
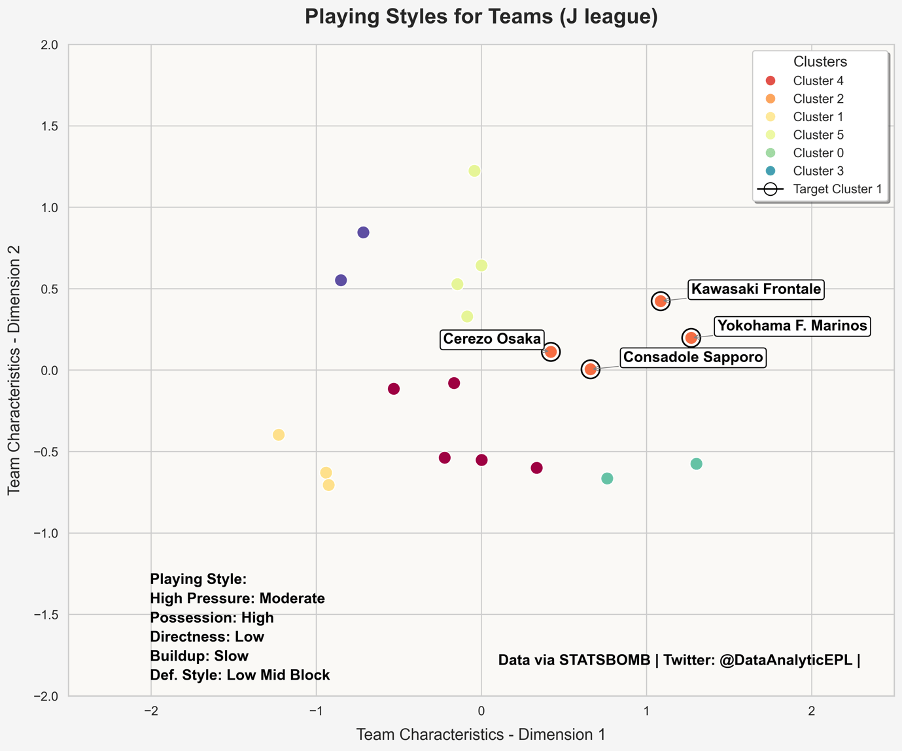
Teams: Kawasaki Frontale, Yokohama F. Marinos, Consadole Sapporo, Cerezo Osaka
Characteristics:
- High possession
- Low directness
- Slow, patient buildup
- Moderate High pressing
- Low mid-block defending
These teams emphasize controlling the game through structured possession and intricate passing sequences.
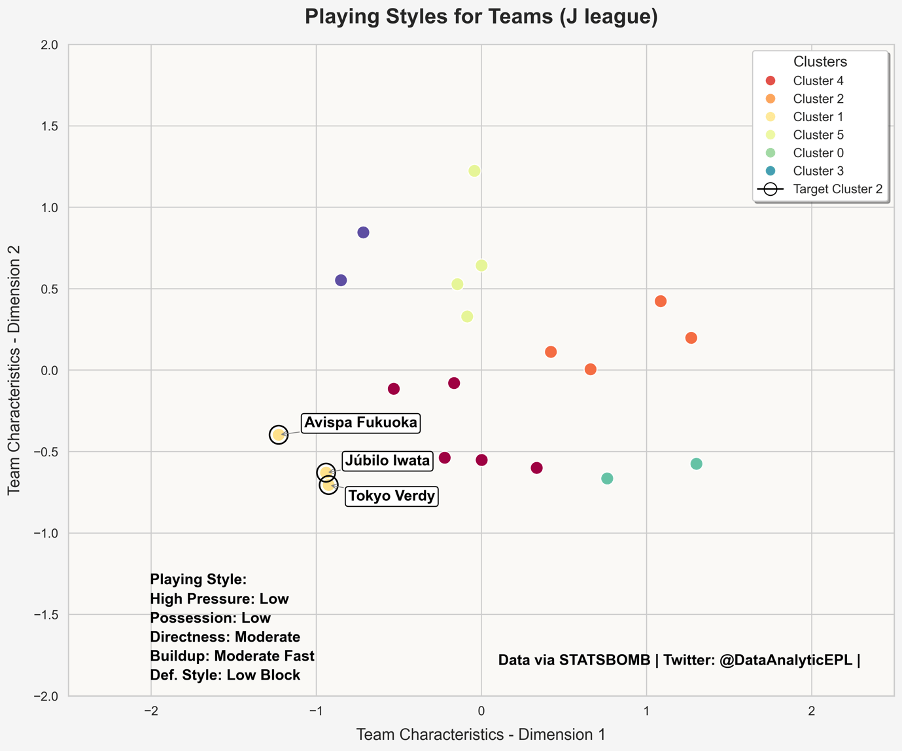
2. Cluster 2 – Reactive, Moderate Directness Teams
3. Cluster 3 – High-Pressing, High-Tempo Teams
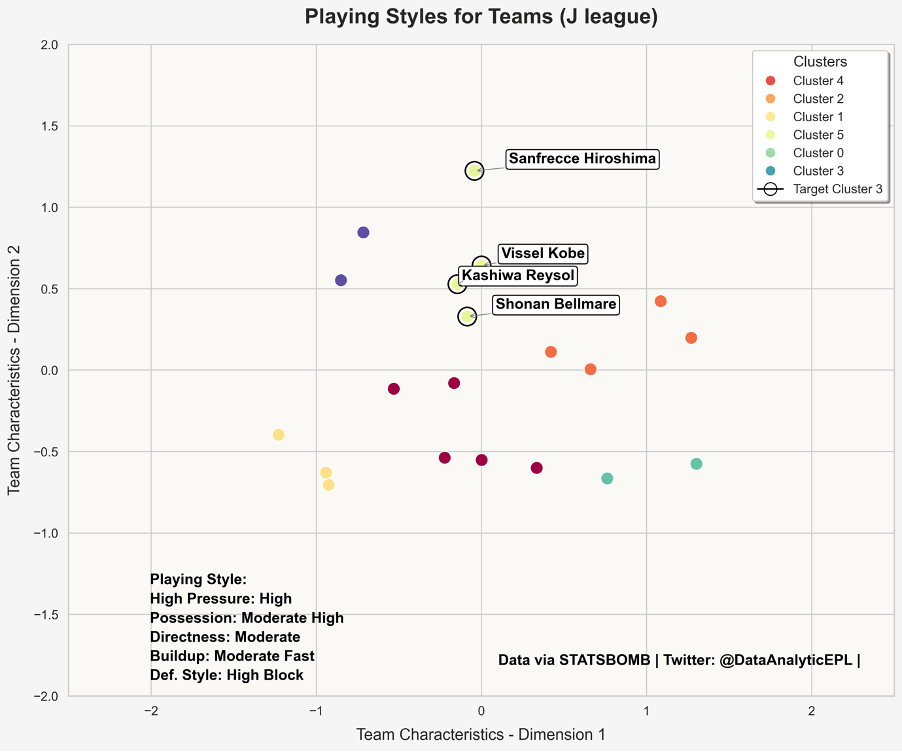
Teams: Sanfrecce Hiroshima, Kashiwa Reysol, Vissel Kobe, Shonan Bellmare
Characteristics:
- High pressing intensity
- Moderate-to-high possession
- Fast buildup
- High defensive line
These teams are front-footed, applying aggressive pressing while maintaining control in possession.
4. Cluster 4 – High Possession, Structured Play Teams
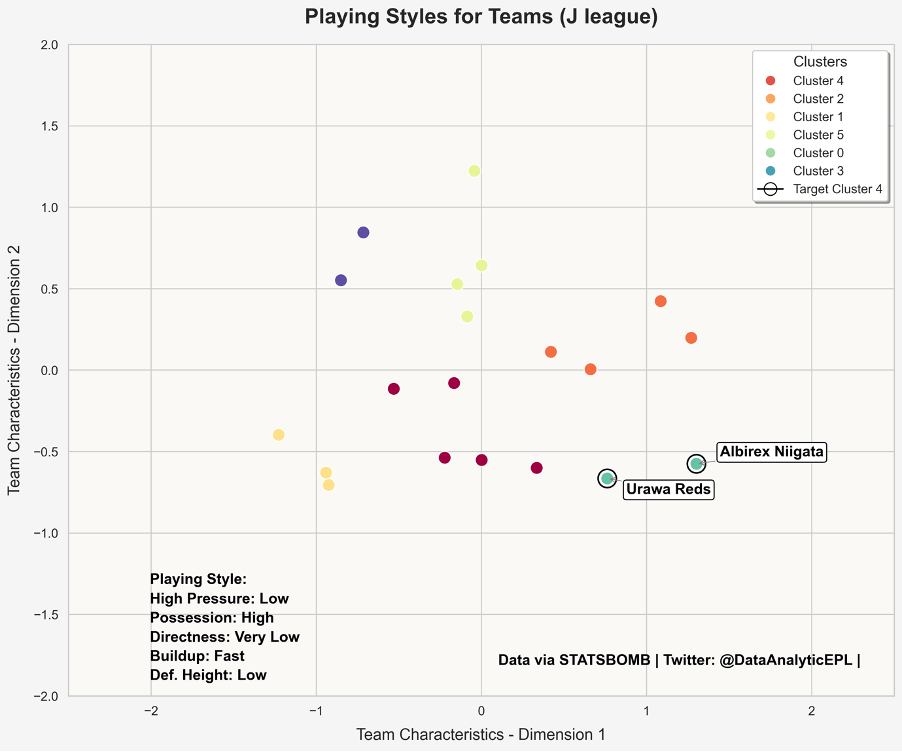
Teams: Albirex Niigata, Urawa Reds
Characteristics:
- High possession
- Very low directness
- Fast buildup speed
- Lower defensive height
- Minimal pressing intensity
This group includes teams that prioritize ball retention but play at a faster tempo.
5. Cluster 5 – Direct, Vertical, Counter Attacking Teams
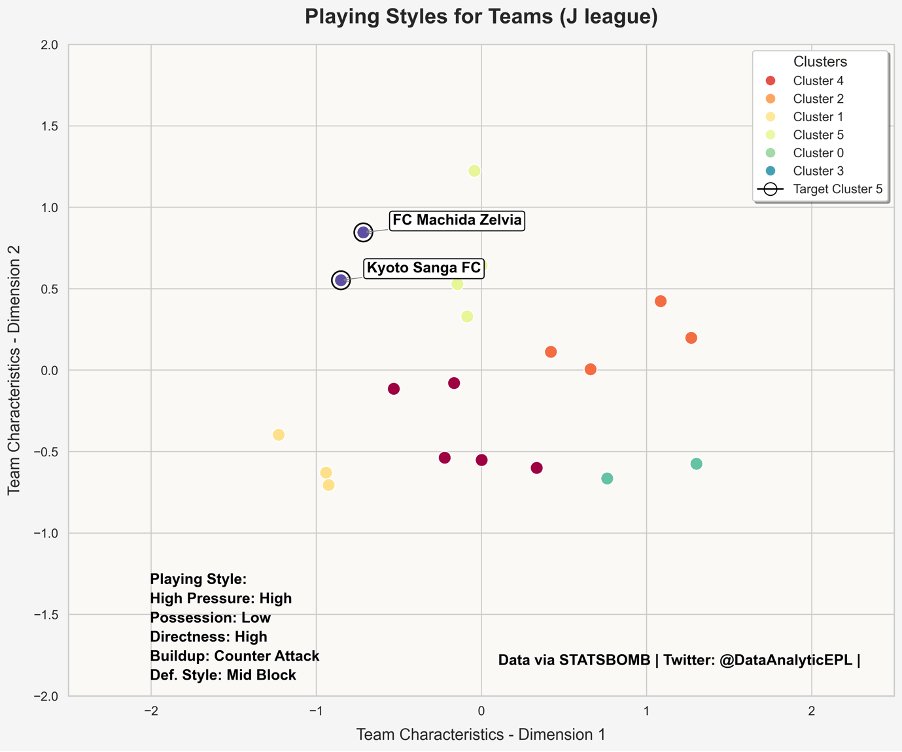
Teams: FC Machida Zelvia, Kyoto Sanga FC
Characteristics:
- Low possession
- High directness
- Counterattack
- Mid-Block Defending
These teams rely on Mid block defending and Counter Attacks.
6. Cluster 6 – Balanced, Transition-Oriented Teams
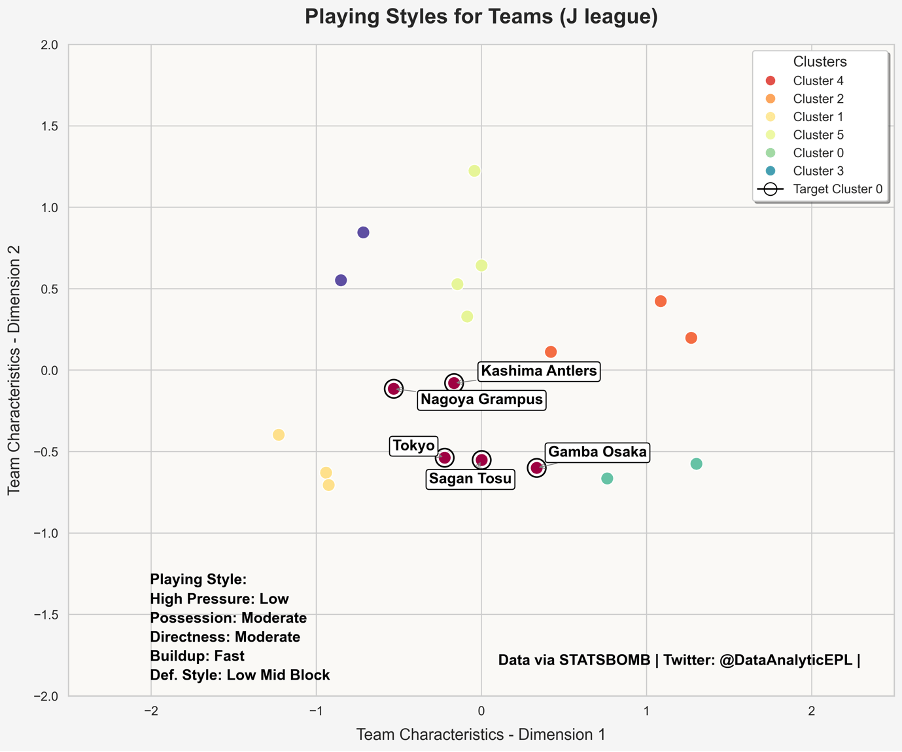
Teams: Kashima Antlers, Nagoya Grampus, Tokyo, Sagan Tosu, Gamba Osaka
Characteristics:
- Moderate possession
- Moderate directness
- Fast buildup play
- Low Mid-block defending
- Low High Pressure
These teams balance both buildup and direct attacking sequences, playing flexibly based on match conditions.
Cluster Representation & Interpretation
Each scatter plot visualizes how teams are grouped based on their playing characteristics, where:
- Clusters are color-coded, indicating distinct playing styles.
- Labelled teams represent key representatives of each playing philosophy.
- Axes denote key tactical dimensions, such as build-up preference and defensive approach.
While the clusters effectively segment teams into logical tactical groups, the sample size is relatively low, which might make some clusters appear scattered. However, this method still provides valuable insights into how different teams approach build-up, pressing, and transition play in the 2024 J League season.
To further validate this approach, a similar analysis, I conducted with 96 teams from Europe’s Top 5 Leagues. The method and results of this extended study can be found at the following link: https://x.com/DataAnalyticEPL/status/1858831337597133229. This broader application reinforces the effectiveness of PCA-based clustering in identifying distinct playing styles across different leagues and competitive environments.
This analysis enables coaches, analysts, and recruiters to identify team tendencies and potential tactical matchups, forming the foundation for strategic decision-making in scouting and opposition analysis.
Part – 2: Kashiwa Reysol’s Playing Style and Performance Analysis
Now, we shift our focus to an in-depth analysis of Kashiwa Reysol, examining their playing style and key performance metrics to uncover insights into their season.
From the cluster analysis, Kashiwa Reysol falls into the same playing style group as Shonan Bellmare, Sanfrecce Hiroshima, and Vissel Kobe. Additionally, a cosine similarity analysis between teams further reinforces their tactical resemblance, as seen in the similarity scores below:
- Shonan Bellmare – 99.99%
- Sanfrecce Hiroshima – 97.28%
- Vissel Kobe – 96.38%
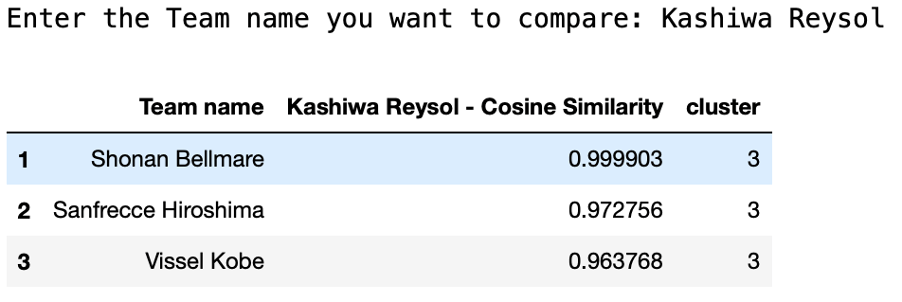
However, while Vissel Kobe and Sanfrecce Hiroshima finished 1st and 2nd in the league, Kashiwa Reysol struggled, finishing just one spot above the relegation zone.
This raises an important question:
If Kashiwa Reysol shares a similar playing style with two of the best-performing teams, why did they struggle so much in terms of results?
As we proceed with the analysis, we will explore their attacking and defensive structure, highlighting their strengths and weaknesses. However, in football, success ultimately comes down to scoring goals and preventing them—and this is where we will find key insights into why Kashiwa Reysol’s season unfolded the way it did.
One of the primary reasons for Kashiwa Reysol’s struggles will become evident when analyzing their efficiency in the box—both in attack and defense.
Cosine Similarity Between the teams in J League

Figure 1: Average Possession for each team in J League
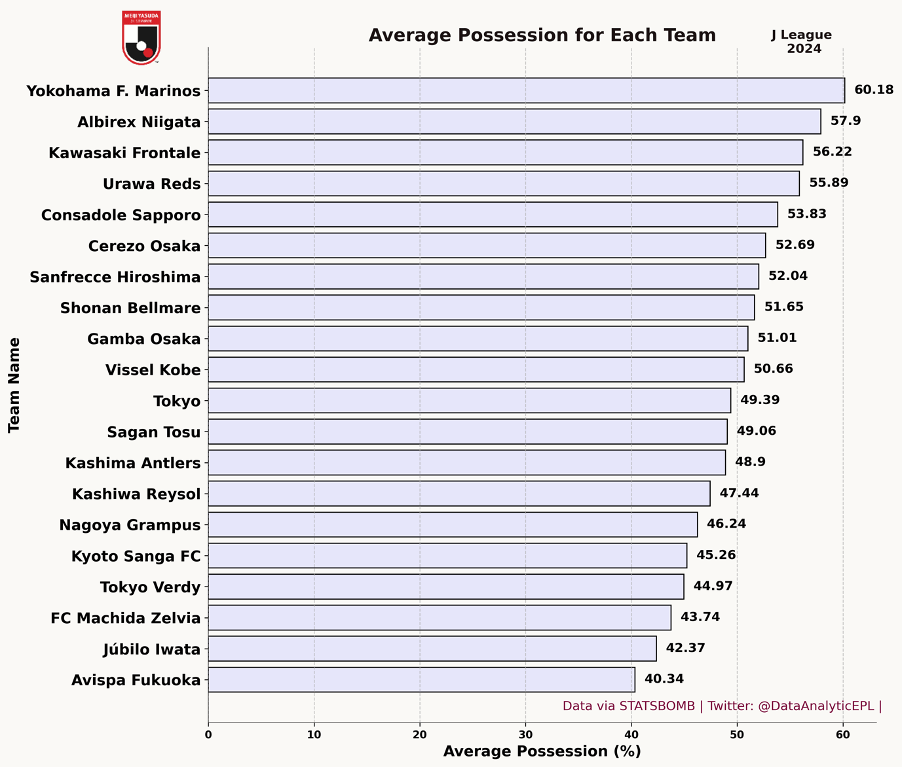
Kashiwa Reysol averaged 47.44% possession in the 2024 J League season, placing them in the mid-table range in terms of ball control. While they do not dominate possession like Yokohama F. Marinos (60.18%) or Albirex Niigata (57.9%), they maintain a balanced approach, capable of both structured buildup and transitional play. This suggests that Kashiwa Reysol is not overly reliant on controlling the game through possession but instead looks to capitalize on moments rather than dictating play.
Figure 2: Average Maintain (%) for each team in J League
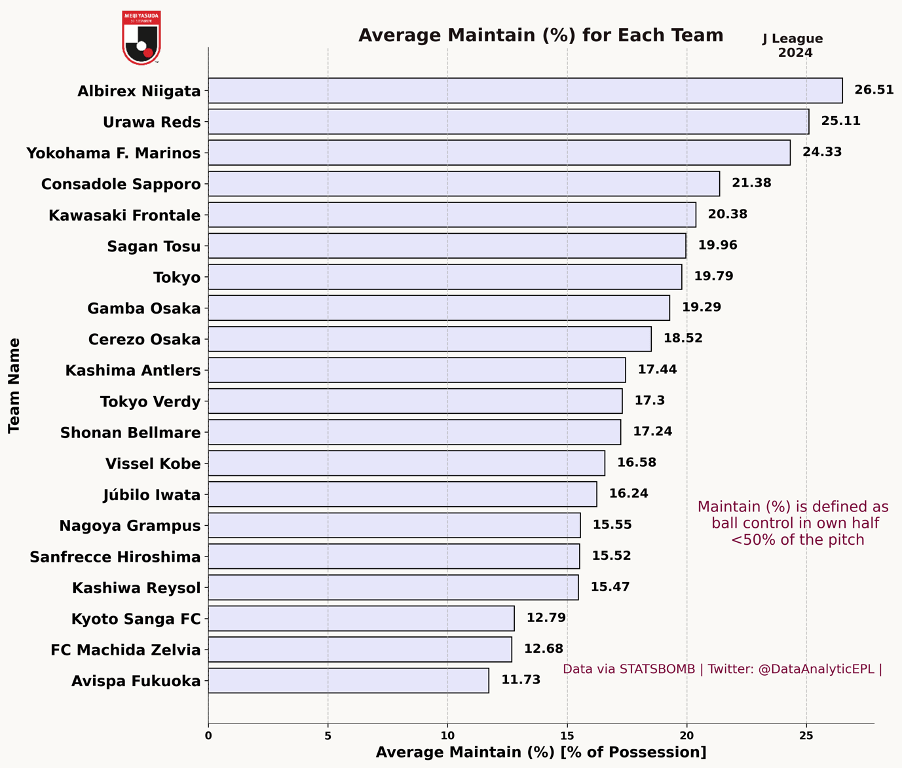
Kashiwa Reysol maintained possession in their own half for 15.47% of their total possession, ranking them in the lower half of the league for this metric. This suggests that they do not heavily rely on recycling possession in deeper areas and instead look to transition the ball forward more quickly. Compared to teams like Albirex Niigata (26.51%) and Urawa Reds (25.11%), who prioritize ball retention in deeper zones, Kashiwa Reysol’s approach indicates a more progressive and forward-thinking buildup strategy rather than a conservative one.
Figure 3: Average Buildup (%) for each team in J League
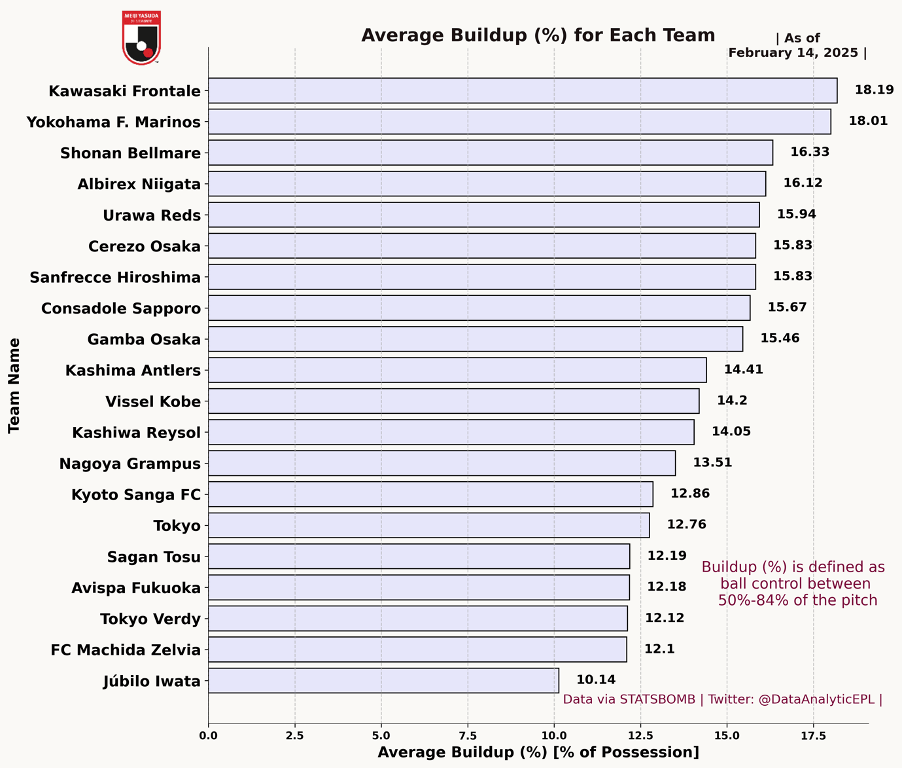
Kashiwa Reysol registered an average buildup percentage of 14.05%, positioning them mid-table in terms of ball control within the midfield zones (50%-84% of the pitch). While teams like Kawasaki Frontale (18.19%) and Yokohama F. Marinos (18.01%) dominate this phase with structured progression, Kashiwa Reysol maintain a balanced approach—capable of both buildup and direct transitions. This reinforces the notion that they do not heavily rely on extended possession sequences but instead look to move the ball forward when opportunities arise.
Figure 4: Average Sustain (%) for each team in J League
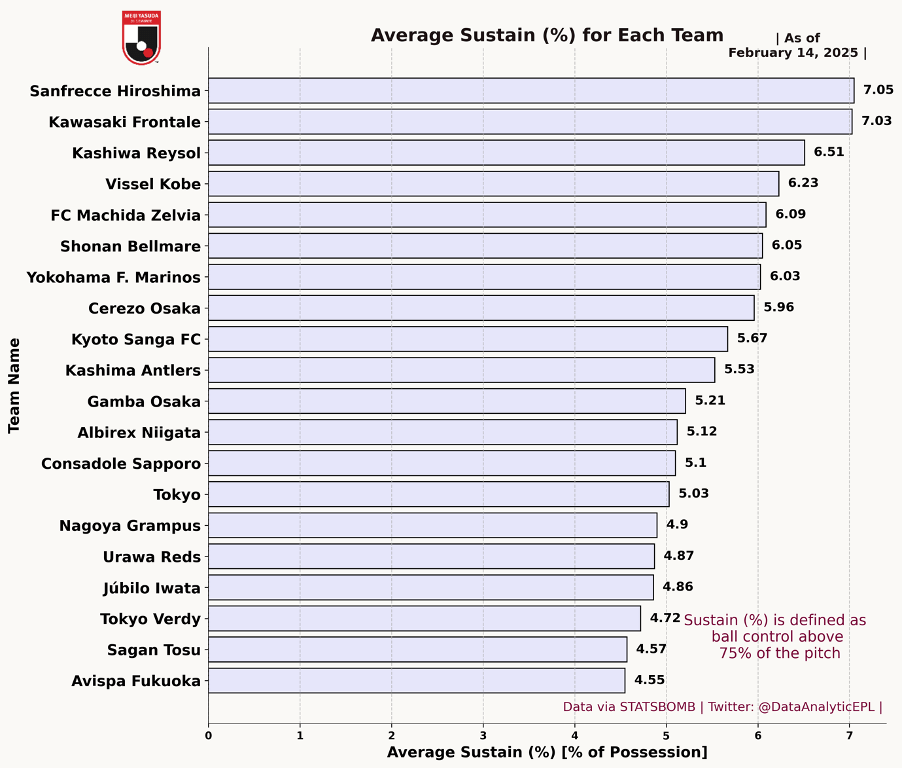
Kashiwa Reysol recorded an average sustain percentage of 6.51%, ranking third in the league for ball control in advanced areas (above 75% of the pitch). This indicates that despite their struggles in the league table, they were effective at sustaining possession in dangerous zones, comparable to Sanfrecce Hiroshima (7.05%) and Kawasaki Frontale (7.03%)—two of the league’s top-performing teams. This suggests that Kashiwa Reysol had a strong attacking presence but may have struggled with efficiency in converting sustained pressure into goals.
Figure 5: Average Verticality for each team in J League
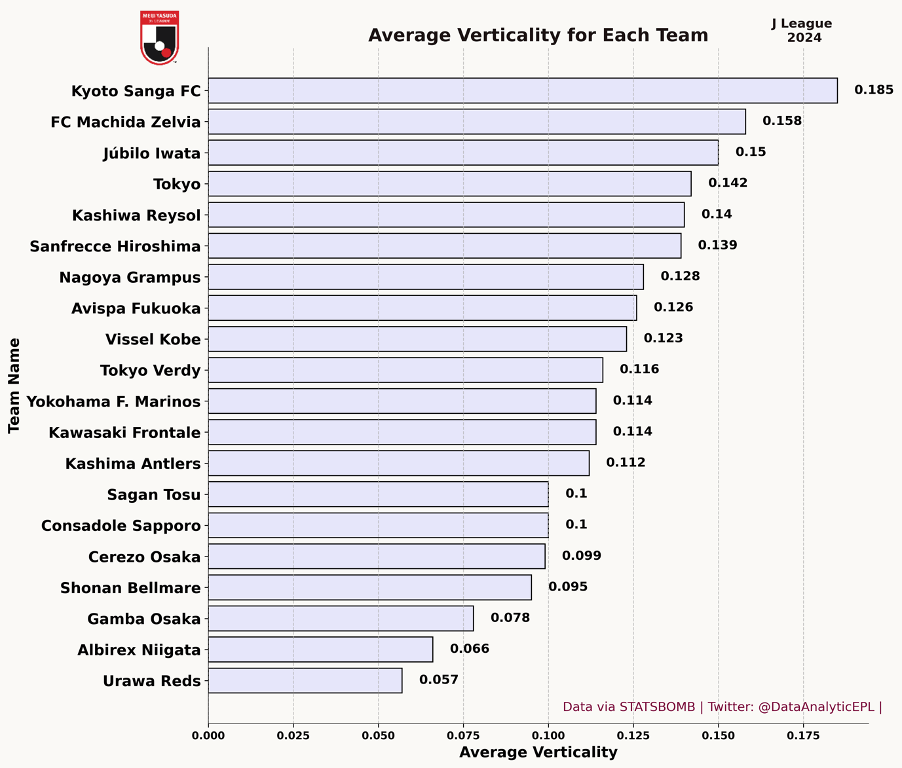
Kashiwa Reysol registered an average verticality of 0.140, placing them among the more direct teams in the league. Their approach is comparable to Tokyo (0.142) and Júbilo Iwata (0.150), indicating a preference for progressing the ball forward efficiently rather than recycling possession. This suggests that Kashiwa Reysol prioritizes quick transitions over slow, methodical buildup, aligning with their strong sustain percentage in advanced areas. However, compared to Kyoto Sanga FC (0.185) and FC Machida Zelvia (0.158), they were slightly less aggressive in their vertical progression.
Figure 6: Average Verticality vs Average Possession for each team in J League
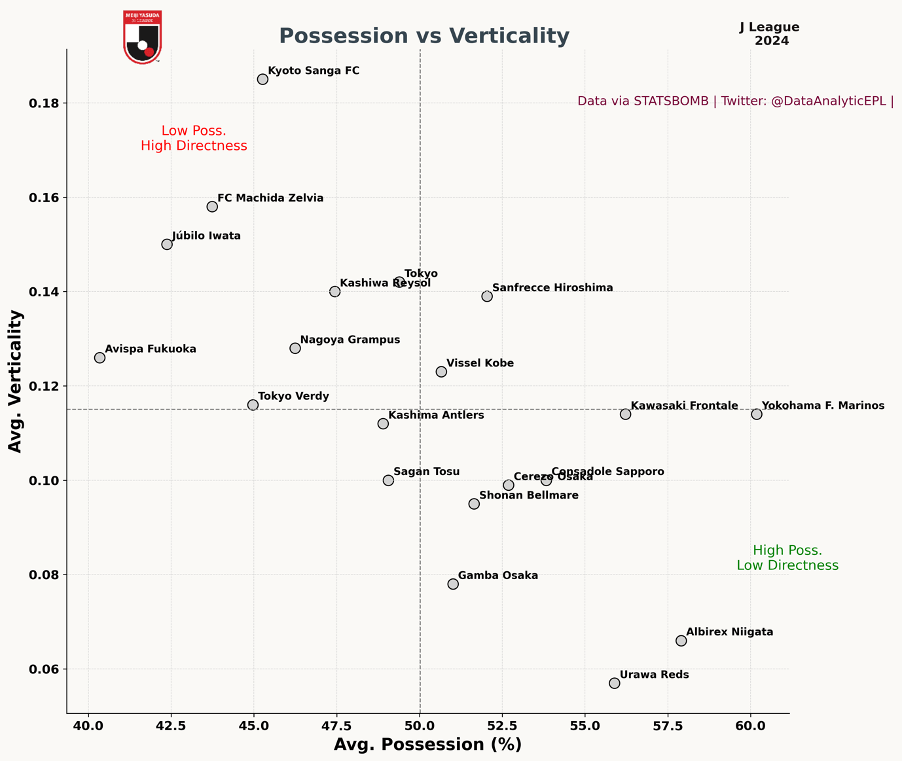
Kashiwa Reysol positions itself in the mid-range of both possession and verticality, indicating a balanced approach between controlling the ball and progressing it forward quickly. They maintain around 47.44% possession while recording an average verticality of 0.140, suggesting they are not a heavily possession-based team but also not excessively direct.
Kashiwa Reysol leans slightly toward directness while still maintaining a level of controlled possession, showing flexibility in their tactical setup. However, this balance did not translate into consistent results, reinforcing the idea that their execution in key moments (goal-scoring and defensive resilience) might be the real issue rather than their overall playing style.
Figure 7: Average PPDA for each team in J League
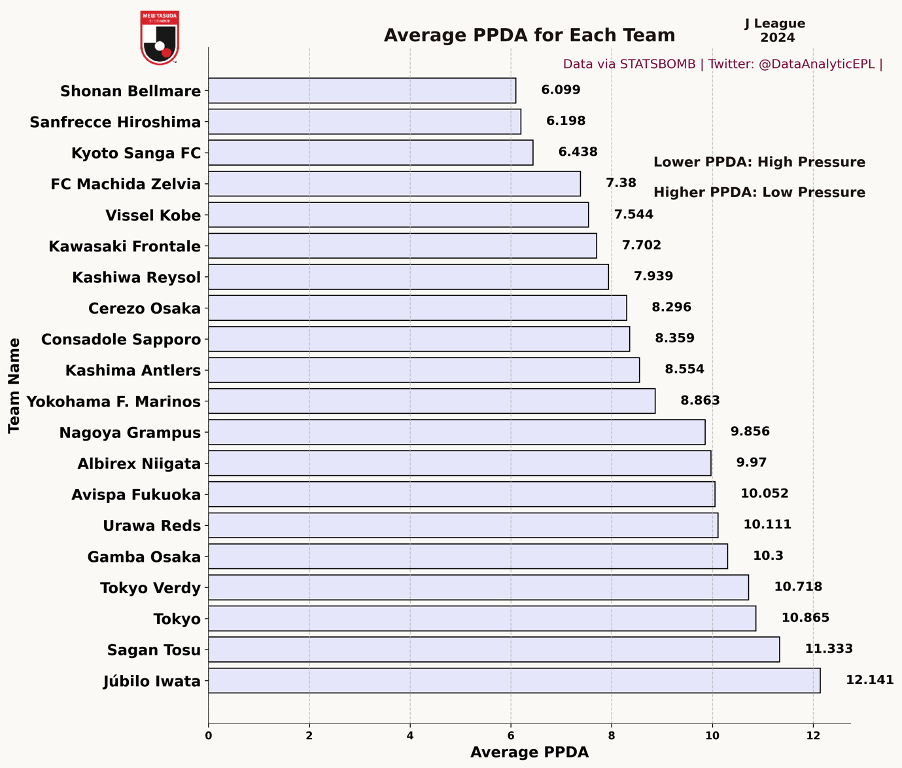
Kashiwa Reysol recorded an average PPDA of 7.939, positioning them as a moderate high pressing team. This metric suggests that while they apply a reasonable level of pressure in higher areas, they are not among the most aggressive pressers like Shonan Bellmare (6.099) or Sanfrecce Hiroshima (6.198).
This pressing approach aligns with their balanced playing style, where they do not commit excessively high up the pitch but still look to disrupt the opponent’s buildup. Their PPDA is lower than possession-heavy teams like Urawa Reds (10.111) or Gamba Osaka (10.3), reinforcing the idea that they do not rely on sitting deep and absorbing pressure but instead adopt a structured pressing strategy without overcommitting.
Figure 8: Average Field Tilt (%) for each team in J League
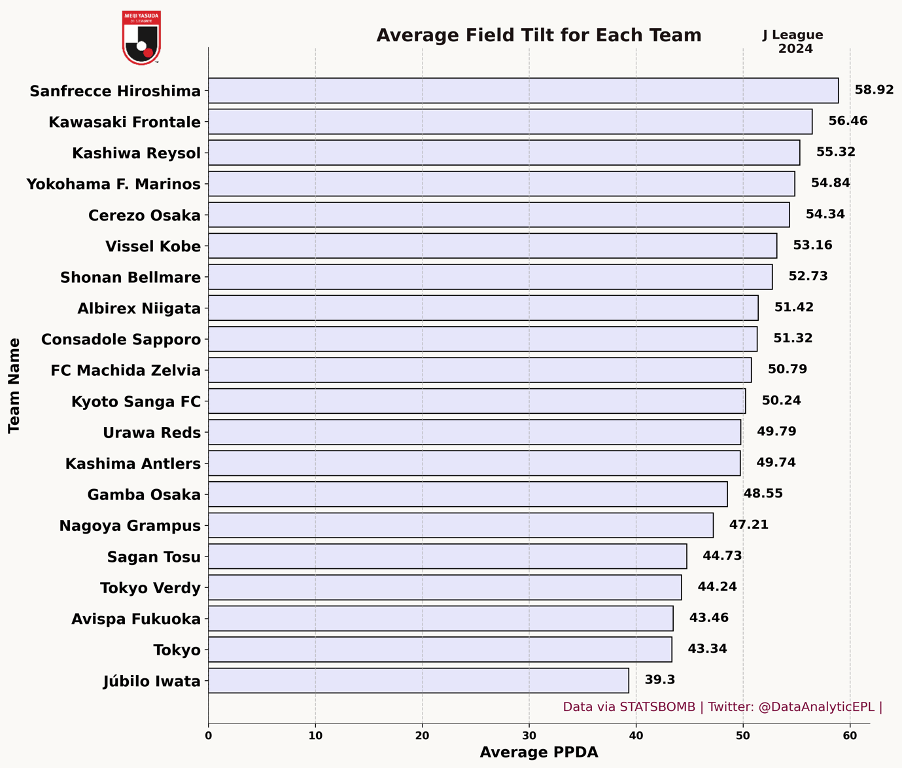
Kashiwa Reysol recorded an average field tilt of 55.32%, ranking them among the top three teams in the league for territorial dominance in the final third. This metric indicates that they spent more time in the opponent’s half compared to their own, reinforcing the idea that they sustain attacks well and apply pressure high up the pitch.
Their high field tilt aligns with their strong sustain percentage (6.51%), further suggesting that they maintain control in advanced areas. However, despite their ability to dominate territory, their league position indicates inefficiency in converting this advantage into goals, likely pointing to finishing struggles or defensive vulnerabilities in transitions.
Figure 9: Passes per sequence for each team in J League
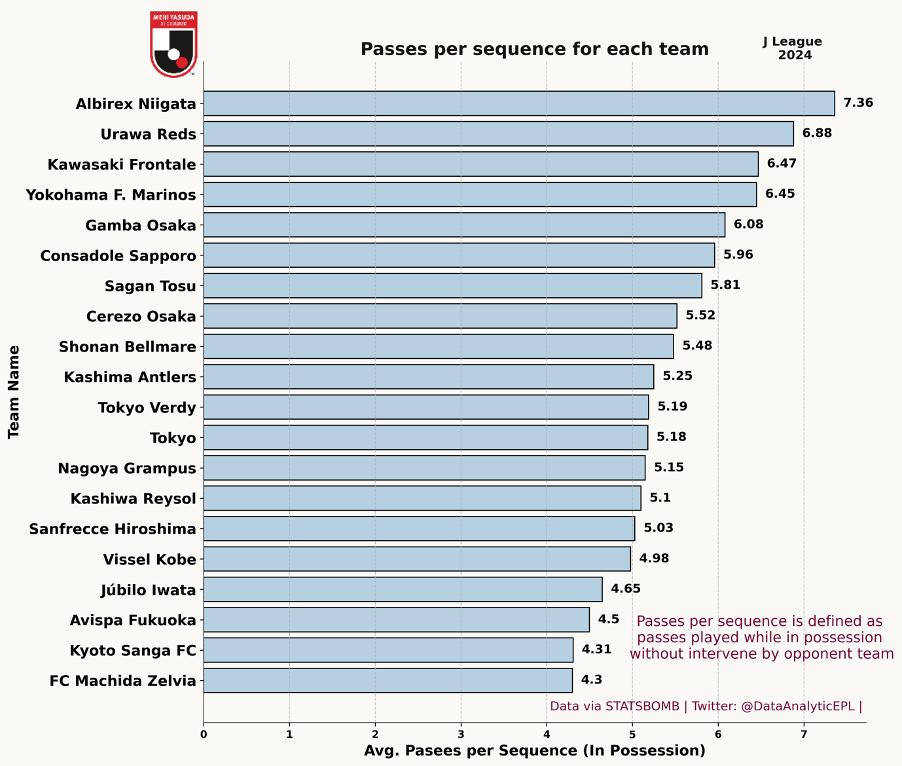
Kashiwa Reysol averaged 5.10 passes per sequence, placing them in the lower mid-table range for this metric. This suggests that while they are capable of controlled buildup, they are not among the most possession-dominant teams like Albirex Niigata (7.36) or Urawa Reds (6.88), who prioritize extended passing sequences.
This aligns with their moderate possession percentage (47.44%) and above-average verticality (0.140), indicating that they prefer a balanced approach—mixing controlled buildup with more direct progression when opportunities arise. Their ranking suggests that Kashiwa Reysol does not overcommit to possession for the sake of control but instead looks for efficient ways to advance the ball forward.
Figure 10: Attacking Passes per sequence for each team in J League
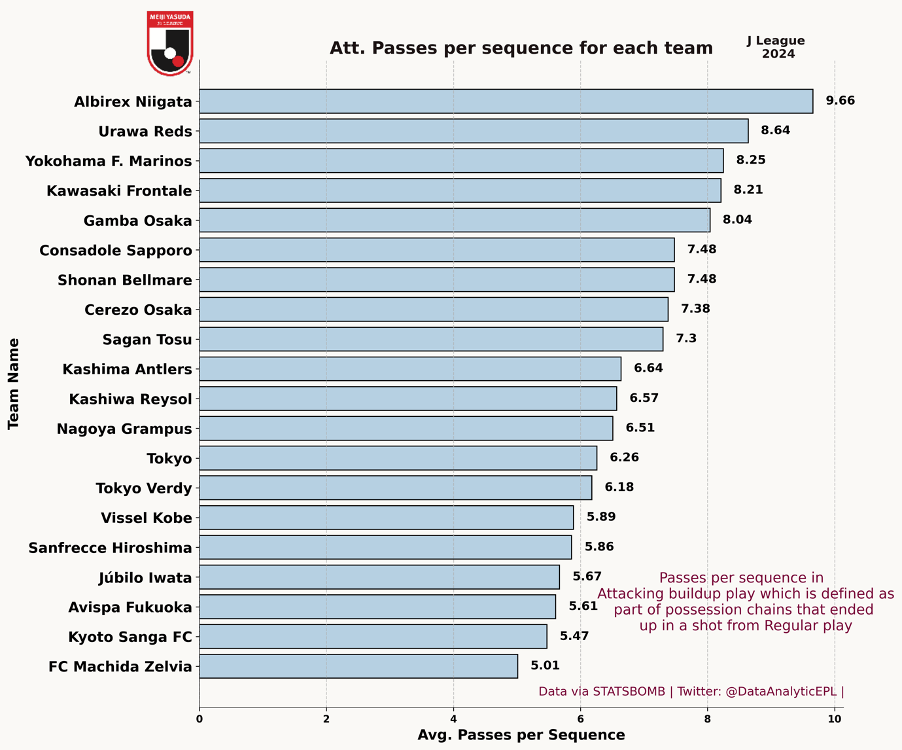
Kashiwa Reysol recorded an average of 6.57 attacking passes per sequence, placing them in the mid-table range for this metric. This suggests that while they are capable of sustaining possession in attacking areas, they do not engage in extended build-up play as much as Albirex Niigata (9.66) or Urawa Reds (8.64), who focus on prolonged attacking sequences.
This reinforces their balanced approach—they are not overly direct, but they also do not engage in overly long attacking phases before attempting a shot. Their ability to sustain possession high up the pitch (as seen in their strong field tilt and sustain percentage) suggests that they create chances but may lack the final incisiveness to convert these sequences into goals consistently.
Figure 11: Attacking Time taken to Buildup a Regular play (i.e., Open play shot)
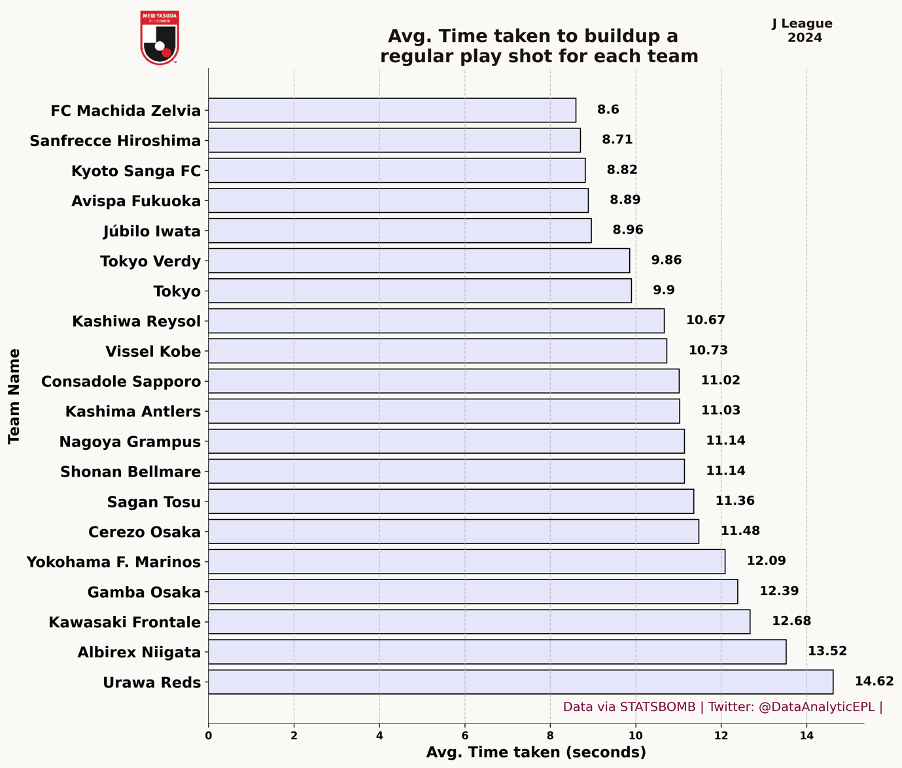
Kashiwa Reysol took an average of 10.67 seconds to build up a shot from open play, placing them in the mid-range of teams regarding the speed of their attacking sequences. This suggests that they do not rely on extremely quick transitions like FC Machida Zelvia (8.6s) or Sanfrecce Hiroshima (8.71s) but also do not engage in overly prolonged build-up like Urawa Reds (14.62s) or Albirex Niigata (13.52s).
This aligns with their balanced playing style—they are capable of structured attacking buildup while maintaining a degree of verticality and directness. However, their moderate time taken to generate shots suggests that they might struggle to break down defensive blocks efficiently, potentially affecting their ability to convert possession into high-quality chances.
Figure 12: Regular play Shot Conversion rate from Possession sequence
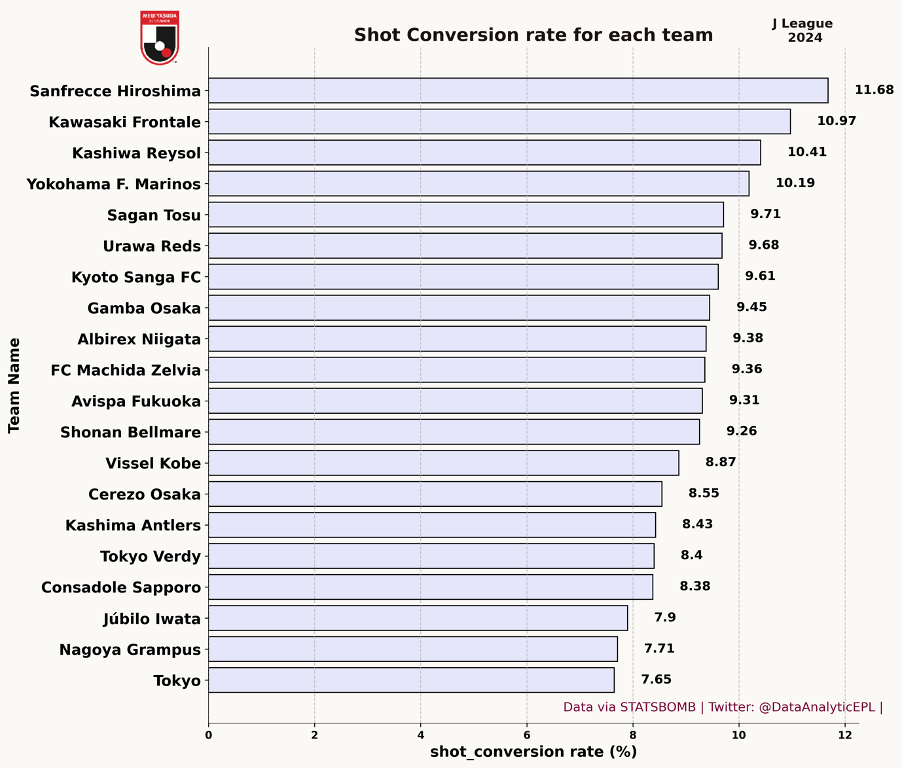
Kashiwa Reysol recorded a shot conversion rate of 10.41%, placing them among the top three most efficient teams in front of goal. This suggests that despite their mid-table possession and buildup metrics, they are highly effective at turning possession sequences into shots, similar to Sanfrecee Hiroshima (11.68%) and Kawasaki Frontale (10.97%).
Figure 13: Average number of Out of Possession (OOP) Pressure
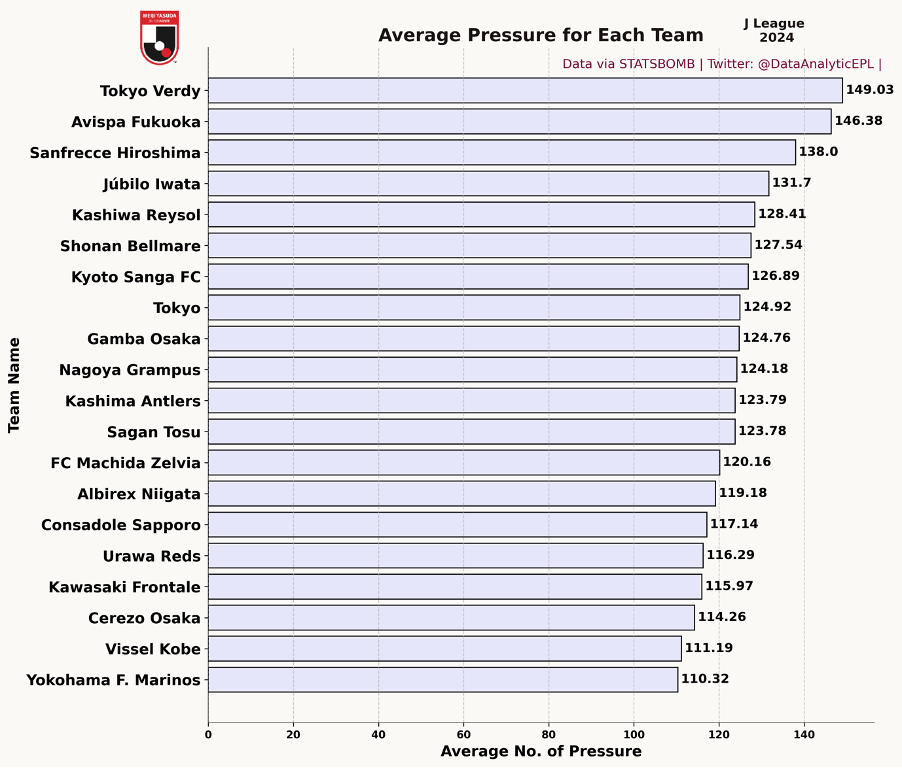
Kashiwa Reysol registered an average of 128.41 pressures per match, positioning them among the top five most aggressive pressing teams in the league. Their pressing intensity is comparable to that of Shonan Bellmare (127.54) and Kyoto Sanga FC (126.89), indicating a strong emphasis on applying defensive pressure on opponents to regain possession quickly.
This level of pressing suggests that Kashiwa Reysol attempts to disrupt opposition buildup play frequently, potentially forcing turnovers in dangerous areas. However, despite their pressing efforts, their league position indicates that their defensive structure post-pressure or efficiency in capitalizing on regained possession might not have been optimal.
This raises the question: Does their pressing strategy effectively contribute to their overall game control, or does it leave them exposed in transitions?
Figure 14: % of Possession Sequences with a Box Entry (Attacking and Defending)
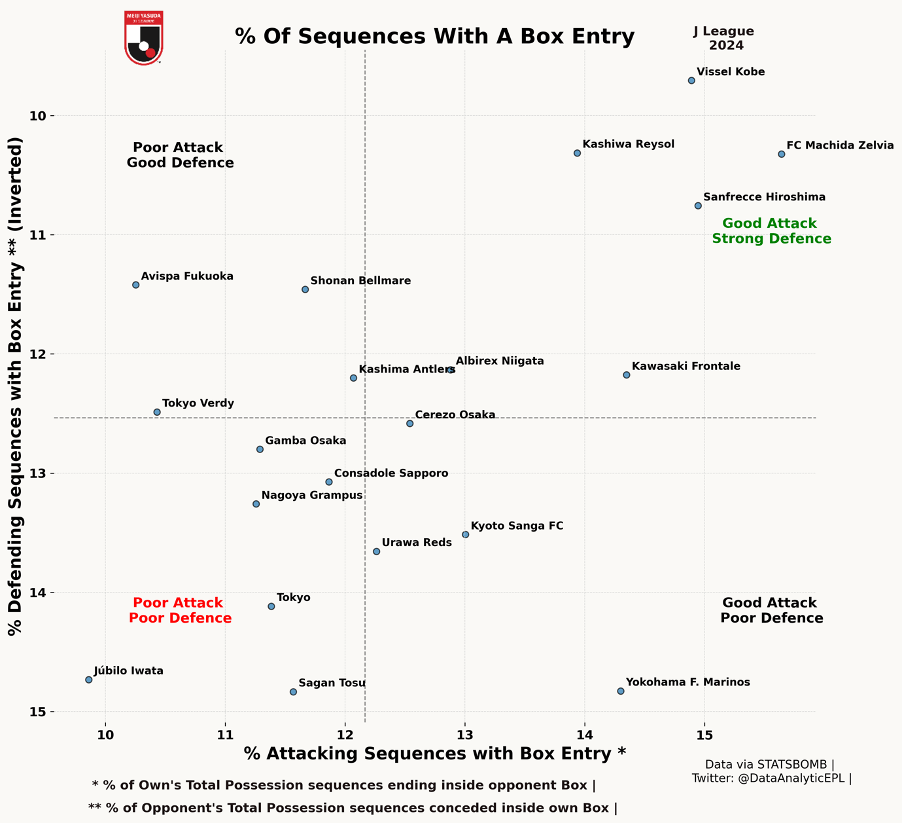
Kashiwa Reysol ranks among the best teams in the league in terms of both attacking sequences leading to a box entry and defending sequences preventing opponent box entries. Positioned in the top-right quadrant, Kashiwa Reysol exhibits a strong attacking presence, frequently penetrating the opposition’s box, while also maintaining defensive solidity by restricting opponents from entering their own defensive box.
This aligns with their pressing intensity and high field tilt, suggesting that their aggressive ball recoveries and territorial control contribute to sustained attacking pressure. However, as we have seen earlier, despite this structural dominance, their league position suggests inefficiencies in converting these penetrations into actual goals.
This leads to a key tactical question: Is Kashiwa Reysol’s inability to translate their territorial dominance into goal-scoring opportunities the main factor behind their struggle in the league table?
Figure 15: % of Possession Sequences with a Box Entry to Attacking Third (Attacking and Defending)
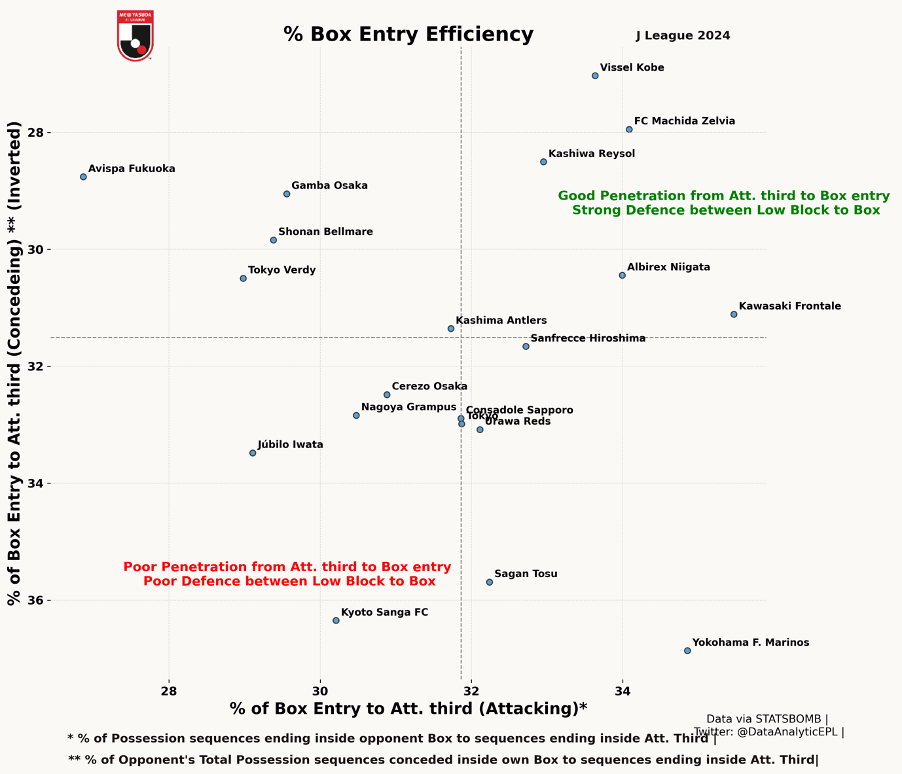
Kashiwa Reysol ranks among the best teams in the league when it comes to penetrating the opposition’s defensive block from the attacking third into the box. Positioned in the top-right quadrant, this suggests that once they reach the final third, they are efficient in progressing into dangerous areas inside the opponent’s penalty box.
Defensively, they also exhibit resilience in preventing opponents from progressing from their attacking third into Kashiwa’s defensive box, reinforcing their strong low-block defensive structure.
This confirms what we observed earlier—Kashiwa Reysol controls territory well and progresses effectively, both offensively and defensively. However, their league position indicates that their major struggles might lie in the final execution—converting these dangerous moments into goals.
This brings us to the next question: If they are so structurally solid in attack and defense, where exactly are they failing? Is it their finishing, chance creation, or game state management?
Figure 16: % of Possession Sequences with a Shot (Attacking and Defending)
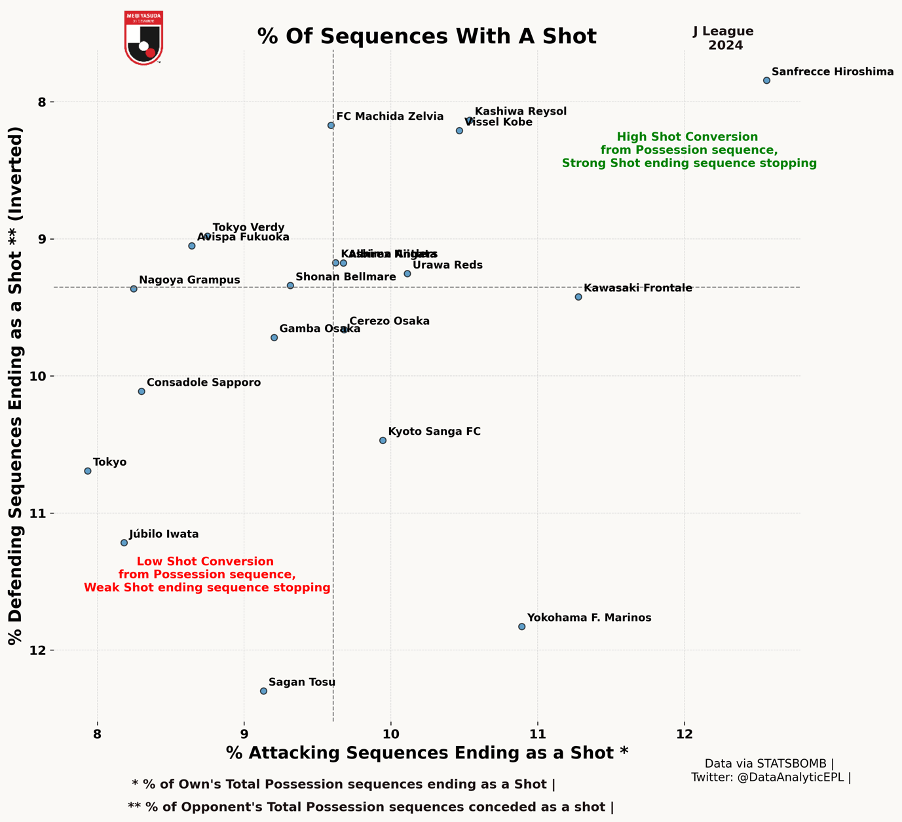
Kashiwa Reysol continues to display strong fundamentals in their approach, ranking among the best in the league at converting possession sequences into shots. Their positioning in the top-right quadrant suggests that they are one of the most efficient teams at turning their possession into shot attempts, while also being effective in preventing opponents from doing the same against them.
This aligns with our previous findings—Kashiwa Reysol is structurally sound, both in attack and defense. They progress well into dangerous areas and are efficient at creating shooting opportunities. However, despite this, their final league position remains concerning.
This leads us to the next critical question: If they are consistently creating shots, why are they not winning more games? Could this be due to shot quality, finishing inefficiency, or defensive lapses at key moments?
Figure 17: Opposition Possession Sequences ended in Att. Third and as a shot
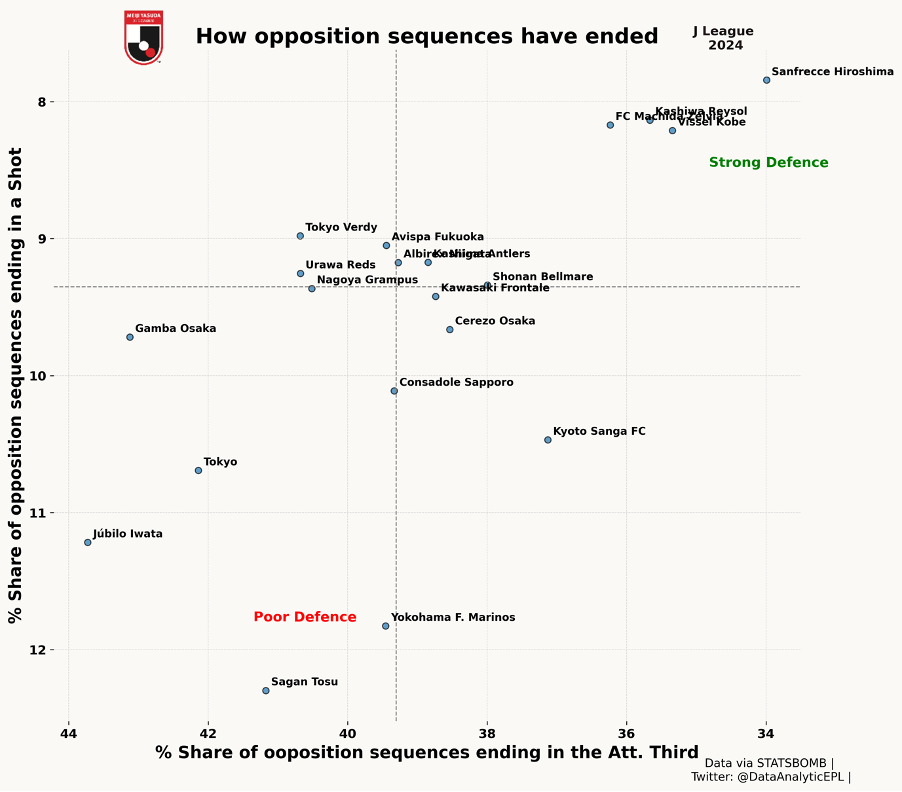
Kashiwa Reysol ranks among the best defensive teams in terms of preventing opposition sequences from ending in shots, placing them in the strong defense quadrant alongside teams like Sanfrecce Hiroshima and Vissel Kobe. This suggests that despite their struggles in the league table, their defensive structure is highly effective in stopping teams from converting attacking sequences into clear-cut chances.
However, this brings us back to the overarching question—if Kashiwa Reysol is excelling defensively and creating a good volume of attacks, why are they struggling in the standings?
Figure 18: Efficiency in the box
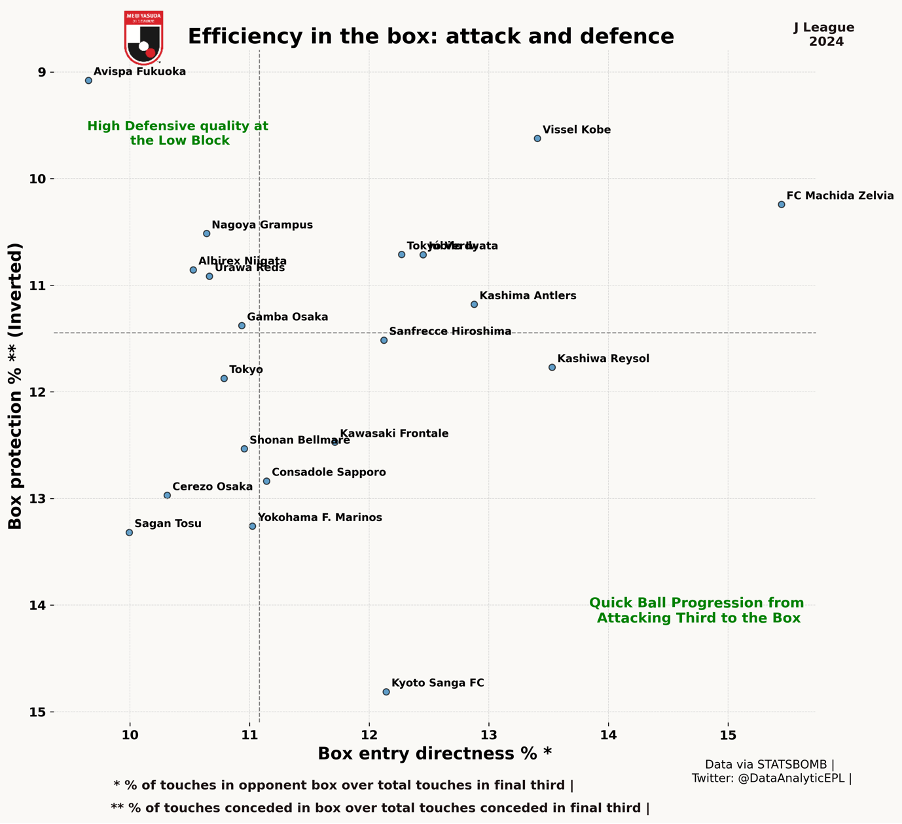
One of the primary reasons for Kashiwa Reysol’s struggles becomes evident when analyzing their efficiency in the box—both in attack and defense.
Despite their quick ball progression into the opponent’s penalty area, their box protection percentage is below average, meaning they concede a high volume of touches inside their own penalty area. While their defensive setup prevents a high number of shot-ending sequences, it appears that when the opposition does manage to enter their box, they are unable to disrupt or prevent high-quality shooting opportunities.
This suggests that while Kashiwa Reysol limits shots overall, they allow too many box entries, which often leads to dangerous chances. In contrast, teams with stronger defensive fortitude in the low block—such as Avispa Fukuoka and Urawa Reds—have a much better box protection percentage.
In summary, their defensive vulnerability inside the box is one of the key factors in their struggles, particularly in tight games where conceding high-percentage shots makes the difference. Next, we will examine another critical issue that compounded their problems.
Figure 19: Efficiency in the box (Shot Conversion and Protection)
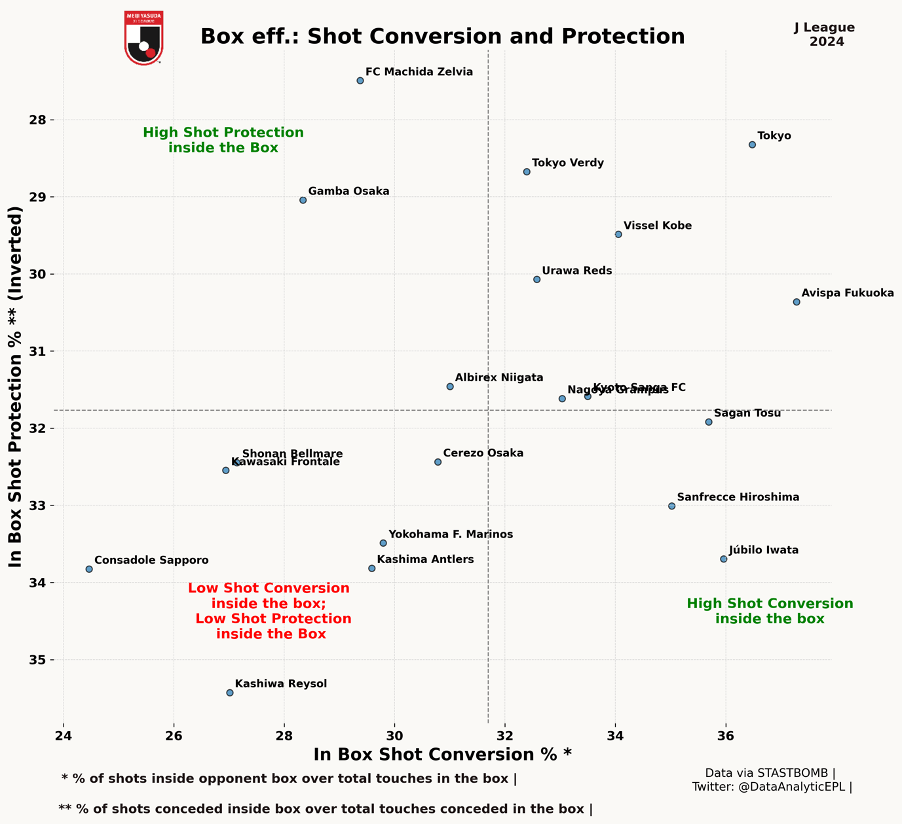
The second major issue behind Kashiwa Reysol’s struggles is their poor shot conversion inside the box combined with low shot protection within their own penalty area.
From the chart, we can see that Kashiwa Reysol falls into the worst-performing quadrant, where teams both struggle to convert their own box touches into quality shots and fail to protect against high-quality opposition shots.
Kashiwa Reysol’s dual inefficiency in attack and defense inside the box is a critical factor in their struggles. Their inability to convert their own opportunities while simultaneously allowing opponents high-percentage shots means they often fail in both penalty areas—which is where matches are ultimately decided.
Figure 20: Efficiency in the box (Goal Conversion and Protection)
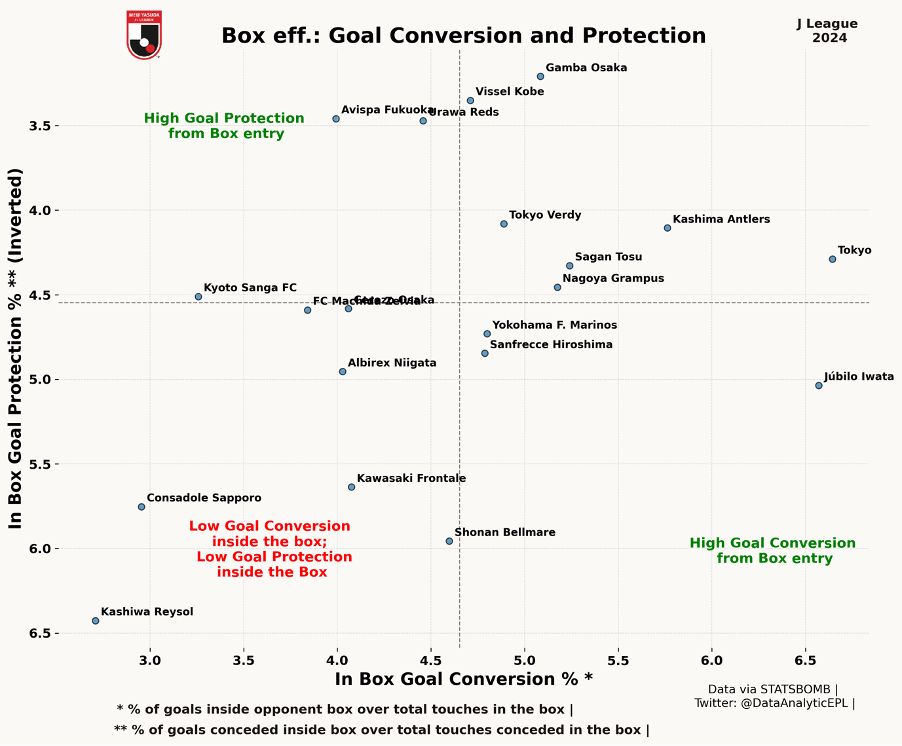
The final and most critical issue behind Kashiwa Reysol’s struggles is their poor goal conversion inside the box coupled with low goal protection, which ultimately determined their position near the relegation zone.
Kashiwa Reysol is positioned in the worst-performing quadrant, indicating one of the lowest goal conversion rates from box entries in the league. Equally concerning is their defensive vulnerability inside the penalty area.
They have one of the highest percentages of goals conceded per box entry, meaning that when opponents enter their penalty area, they frequently convert their chances into goals.
Kashiwa Reysol’s season-long struggles can be traced back to their inefficiency at both ends of the pitch—they have not only failed to convert their own box entries into goals but have also conceded far too easily when defending inside their penalty area.
In modern football, the two most decisive areas are the attacking and defensive penalty boxes—and Kashiwa Reysol’s weaknesses in both have been the defining reason for their disappointing campaign.
Figure 21: Average Turnovers Made and Conceded
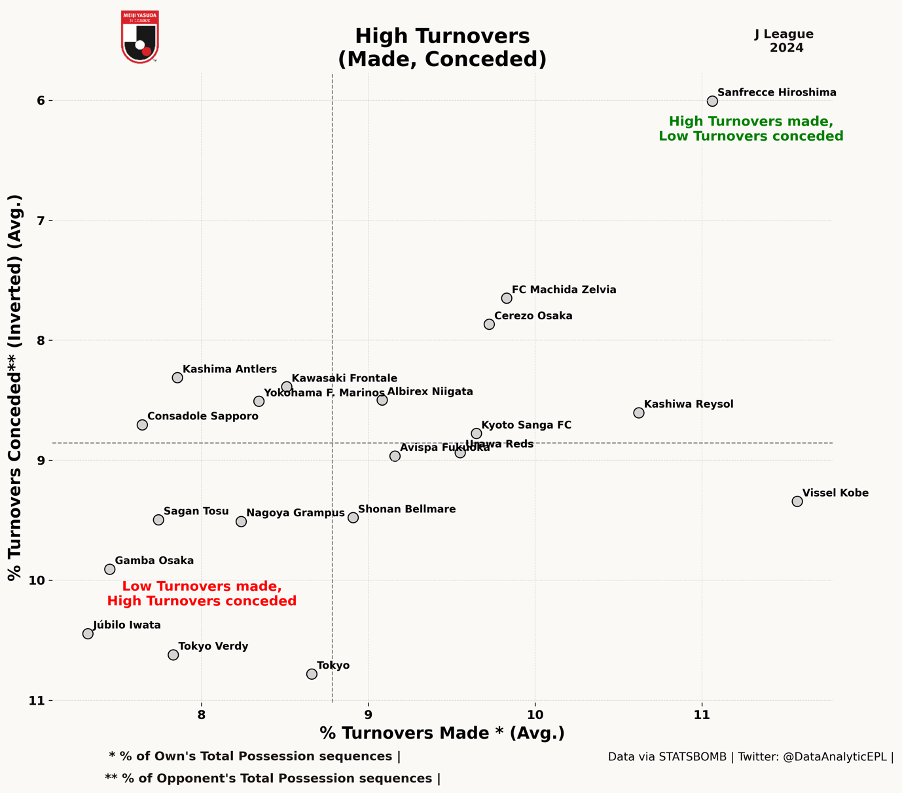
Kashiwa Reysol ranks high in both turnovers made and conceded, reflecting an aggressive but risky pressing style. They are among the better teams at forcing turnovers through high intensity pressing, disrupting opponents’ build-up play. They frequently lose possession, highlighting issues with risky passing, composure under pressure, and defensive build-up errors. Top teams like Vissel Kobe maintain a better turnover balance, pressing effectively without sacrificing possession.
Figure 22: % of Turnovers Leading to Shots (Attacking and Conceding)
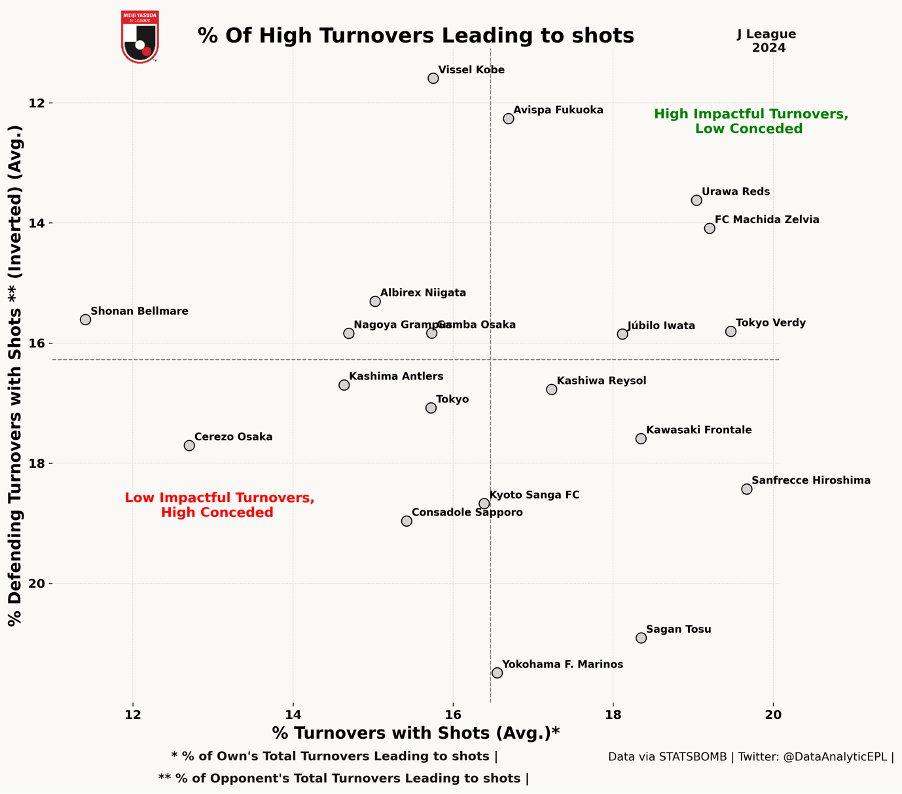
Kashiwa Reysol struggles with turnovers leading to shots, highlighting both attacking potential and defensive frailties. They are active in forcing turnovers high up the pitch, creating offensive opportunities. However, their conversion efficiency from these turnovers is lower than elite pressing teams like Vissel Kobe and Sanfrecce Hiroshima.
Defensively, they concede a high number of shots from turnovers, exposing issues such as, Poor recovery structure after losing possession, Ineffective counter-pressing and Defensive vulnerabilities against quick transitions.
Figure 23: High Turnovers, Turnovers leading to shots and conversion rate
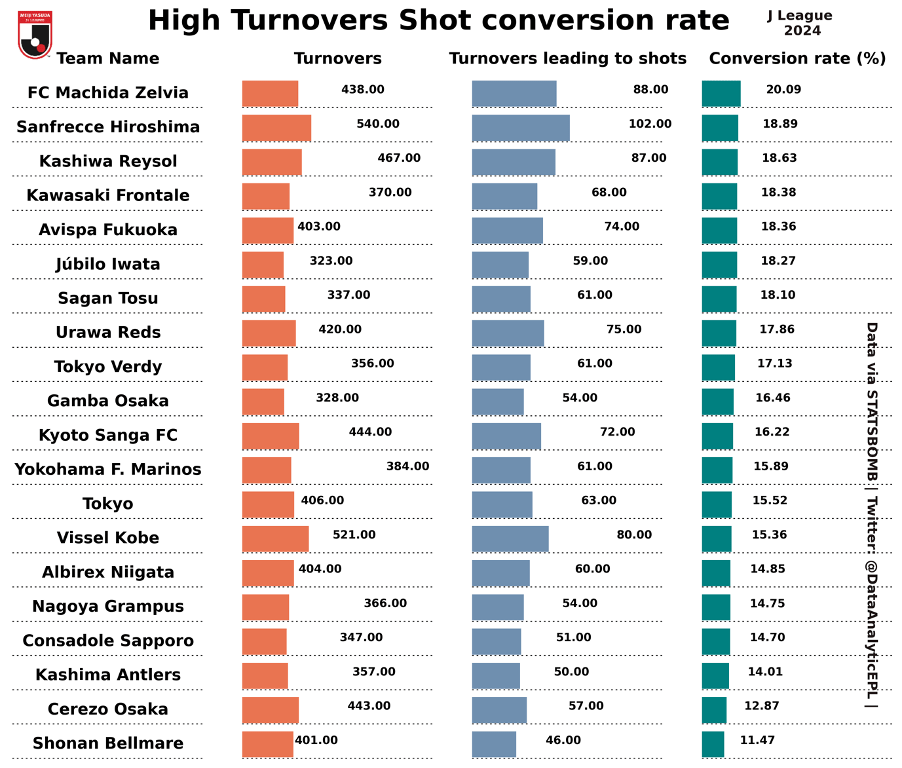
Kashiwa Reysol is active in forcing turnovers, but their effectiveness in converting them into goals is mixed, with 467 turnovers, they rank among the highest in the league, showing aggressive pressing—just behind Sanfrecce Hiroshima and FC Machida Zelvia. Despite their pressing, only 87 turnovers resulted in shots, indicating issues in transition play or final-pass execution compared to Hiroshima (102) and Machida Zelvia (88).
Summary: Kashiwa Reysol: Detailed Playing Style Analysis
In our exploration of Kashiwa Reysol’s playing style, we compared key metrics such as Average Speed, Direct Speed, Passes per Sequence, Defensive Height, and Verticality. While pairwise comparisons provided insight, a comprehensive understanding required analyzing all variables collectively—hence our use of PCA-based K-means clustering.
Similarity Analysis
Kashiwa Reysol shares a cluster with Shonan Bellmare, Sanfrecce Hiroshima, and Vissel Kobe, as shown by cosine similarity scores. However, despite playing a similar style, Kashiwa Reysol finished near the relegation zone, while Vissel Kobe and Sanfrecce Hiroshima claimed the top two spots.
Possession Metrics Overview
- Possession (47.44%): Below league average, indicating a preference for transitions rather than prolonged possession.
- Maintain Phase (15.47%): Among the lowest, highlighting a limited focus on building from deep areas.
- Buildup Phase (14.05%): Moderate, showing a balanced approach in mid-phase control.
- Sustain Phase (6.51%): High, indicating effective control in the final third.
- Verticality (0.14): High directness, reinforcing a preference for quick vertical attacks over patient buildup.
Pressing & Defensive Style
- PPDA (7.939): Reflects a high-pressing, intense defensive approach.
- Field Tilt (55.32%): Shows control of territory, especially in advanced areas.
- Pressures (128.41): High engagement, ranking among the top pressers.
Attacking Efficiency & Shot Creation
- Passes per Sequence (5.1): Indicates a direct, fast-paced style.
- Attacking Passes per Sequence (6.57): Moderate, suggesting efficiency in final-third play.
- Shot Conversion (10.41%): Strong, reflecting clinical finishing.
- Possession-to-Box Entry (High): Quick progression into the box.
- Possession-to-Shot Efficiency: Among the best, converting possessions into shots effectively.
Box Efficiency Issues: Key Area of Struggle
Despite strong territory control, Kashiwa Reysol struggles inside the box:
- Box Entry Directness (12.2%): Efficient at reaching the box but…
- In-Box Shot Conversion (24.5%) and In-Box Goal Conversion (3%): Poor, indicating issues with chance quality or finishing.
- In-Box Shot Protection: Weak, conceding high-quality chances.
Turnover Impact: Strength & Weakness
- Turnovers Made: High (467), driven by aggressive pressing.
- Turnovers Leading to Shots: Moderate (87), indicating issues in exploiting high recoveries.
- Shot Conversion from Turnovers: Strong (18.63%), but slightly below the best teams.
- Turnovers Conceded: High, leaving them vulnerable to quick counters.
Why Did Kashiwa Reysol Struggle?
Kashiwa Reysol exhibits strengths in pressing, box entries, and shot conversion from turnovers. However, their struggles stem from:
- Inefficiency in converting box entries into goals.
- Weak defensive protection inside their own box.
- Vulnerability to transitions due to high turnovers conceded.
Addressing these issues—particularly improving in-box efficiency and counter-pressing resilience—is crucial for Kashiwa Reysol to turn their aggressive style into consistent results.
Part – 3: Additional analyses of the teams in J League 2024
Figure 1: Ball Progression: Defensive Third to Mid Third
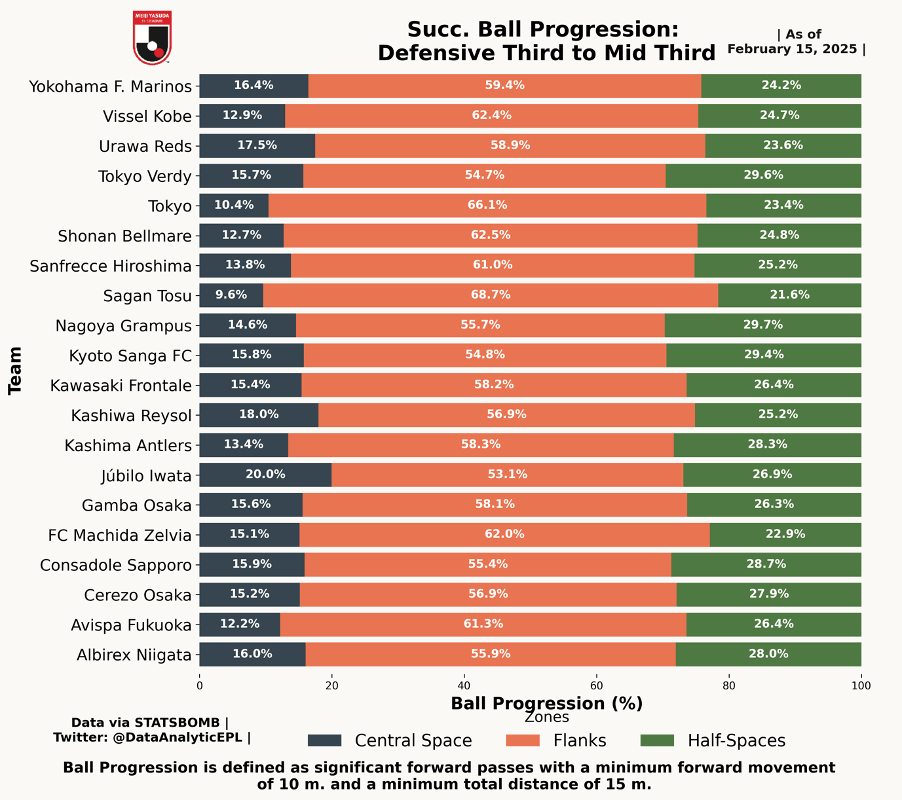
This visualization breaks down how J League teams progress the ball from their defensive third into the middle third, highlighting their preferred zones of advancement: central space, flanks, or half-spaces.
Wide-Oriented Teams: Teams like Sagan Tosu (68.7%), Tokyo (66.1%), and Vissel Kobe (62.4%) heavily favor the flanks for ball progression, leveraging width to bypass defensive structures and create overloads.
Central Progression Specialists: Júbilo Iwata (20%), Kashiwa Reysol (18%), and Urawa Reds (17.5%) show a strong inclination toward progressing through central spaces, indicating a more direct, vertical build-up style with quick passing combinations through the middle.
Balanced Approaches: Teams like Nagoya Grampus (29.7%), Kyoto Sanga FC (29.4%), and Tokyo Verdy (29.6%) make significant use of half-spaces, blending central penetration with wide play to destabilize defensive lines.
This distribution of ball progression zones offers insights into each team’s tactical tendencies—whether they prioritize width for crossing opportunities or central channels for quick vertical attacks.
Figure 2: Ball Progression: Middle Third to Attacking Third
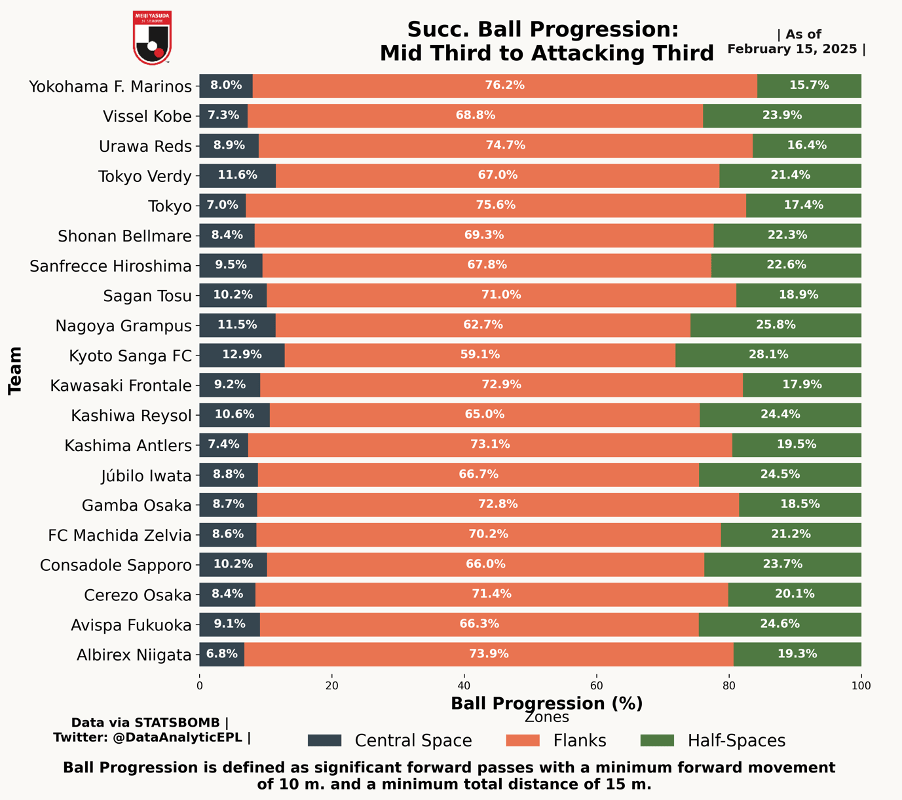
This visualization captures how J League teams progress the ball from the middle third into the attacking third, revealing their preferred routes—central space, flanks, or half-spaces—when advancing into scoring areas.
Flank-Dominant Attacks: Teams such as Yokohama F. Marinos (76.2%), Kashima Antlers (73.1%), and Kawasaki Frontale (72.9%) rely heavily on wide play, seeking crossing opportunities and exploiting space along the wings to break into the final third.
Central Penetration Specialists: Tokyo Verdy (11.6%), Nagoya Grampus (11.5%), and Kyoto Sanga FC (12.9%) show a strong tendency to attack directly through the central lanes, utilizing quick passing combinations and incisive runs to break down defences.
Half-Space Utilizers: Teams like Kyoto Sanga FC (28.1%), Nagoya Grampus (25.8%), and Avispa Fukuoka (24.6%) make significant use of half-spaces, blending vertical progression with width to create more dynamic attacking angles.
This breakdown of ball progression patterns reflects each team’s approach to breaking into the attacking third—whether through structured wide play, direct central drives, or exploiting half-space channels for creative entries.
Figure 3: Out of Possession Pressure by Pitch Third
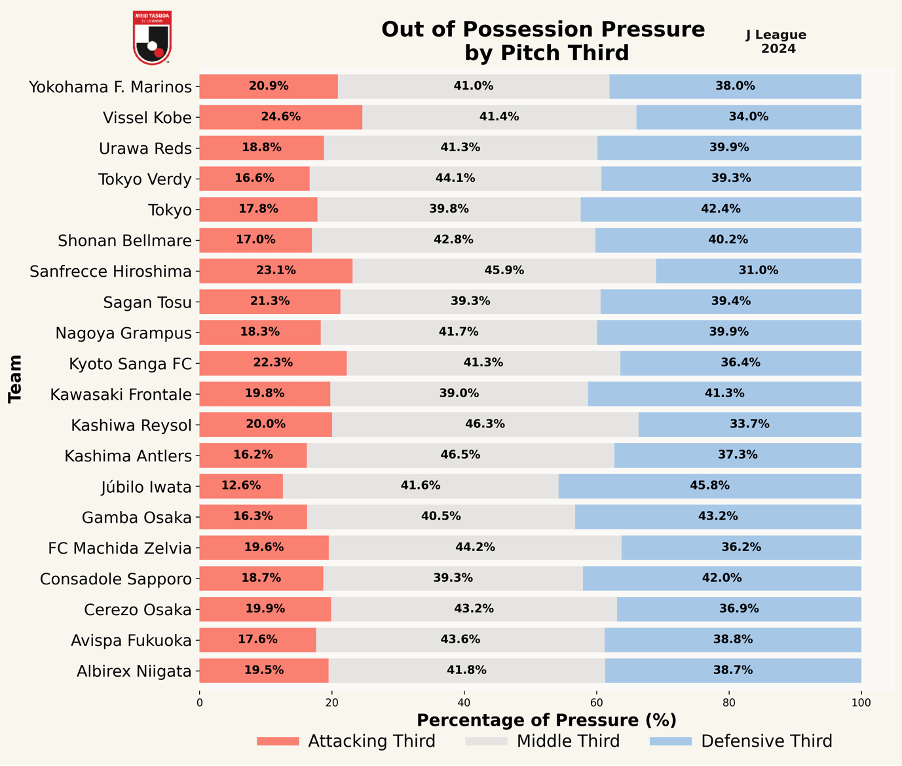
This visualization showcases how J League teams apply defensive pressure across different pitch zones—attacking third, middle third, and defensive third—providing insights into their pressing strategies.
High Pressing Teams (Attacking Third Focus): Vissel Kobe (24.6%), Sanfrecche Hiroshima (23.1%), and Kyoto Sanga FC (22.3%) apply intense pressure high up the pitch, aiming to disrupt opponents’ build-up and force turnovers close to goal.
Mid-Block Pressing Teams (Middle Third Focus): Teams such as Kashiwa Reysol (46.3%), Kashima Antlers (46.5%), and Sanfrecche Hiroshima (45.9%)emphasize pressure in the middle third, focusing on intercepting passing lanes and controlling central spaces.
Deep-Block Defenders (Defensive Third Focus): Júbilo Iwata (45.8%), Gamba Osaka (43.2%), and Tokyo (42.4%) rely on a low-block approach, prioritizing defensive compactness and breaking up plays closer to their own goal.
This distribution of out-of-possession pressure highlights distinct defensive philosophies, from aggressive high pressing to resilient deep-block strategies, shaping how teams defend and transition in the 2024 J League season.
Figure 4: J League Teams’ Goalkeepers’ Ball Distribution
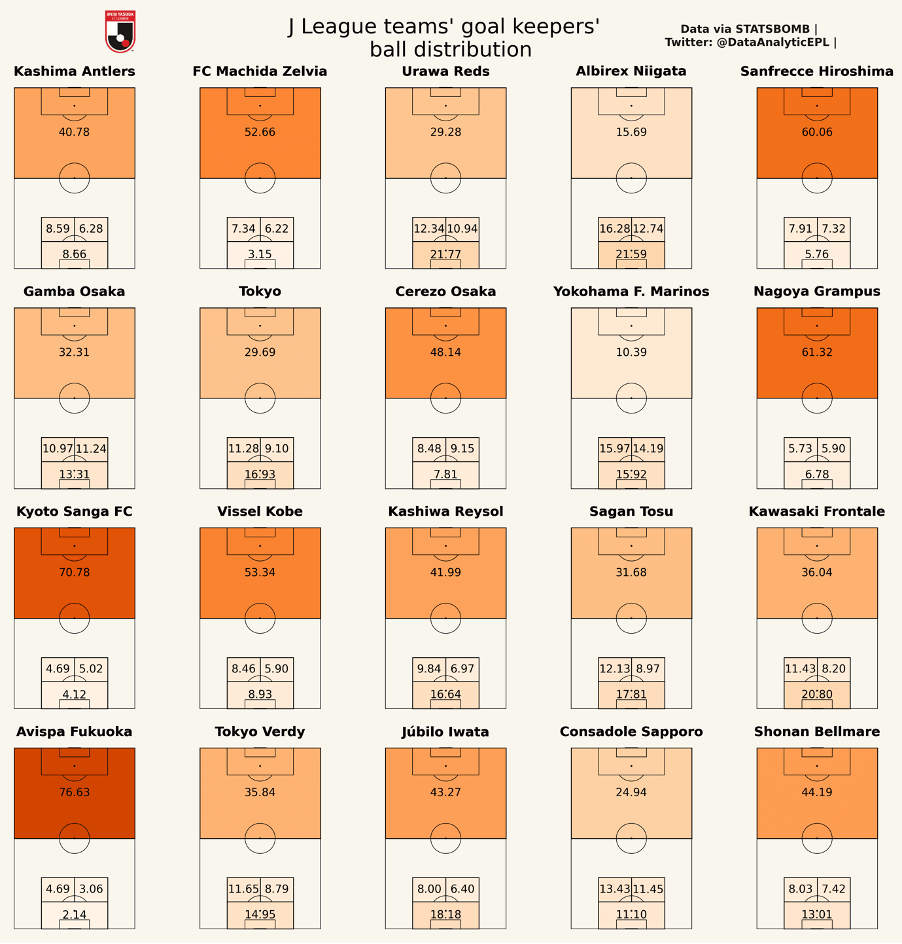
This visualization presents how goalkeepers distribute the ball across different zones of the pitch, offering insights into each team’s buildup patterns from the back.
Long Distribution Teams (Direct Play): Teams like Kyoto Sanga FC (70.78%), Avispa Fukuoka (76.63%), and Nagoya Grampus (61.32%) Favor long, direct distributions, often bypassing the midfield to target advanced areas. This approach suits a direct, transition-based playing style.
Mixed Distribution Teams: Kashiwa Reysol (41.99%), Vissel Kobe (53.34%), and FC Machida Zelvia (52.66%) exhibit balanced distribution patterns, splitting play between long balls and short passes to central or half-space zones, enabling flexible transitions.
Short Distribution Teams (Possession-Based): Albirex Niigata (15.69%), Yokohama F. Marinos (10.39%), and Consadole Sapporo (24.94%) focus on short distributions, building play patiently from the back through defenders and midfielders.
This breakdown highlights the variations in goalkeepers’ roles in ball progression, reflecting each team’s broader tactical identity, from possession-oriented structures to direct, counter-attacking strategies.


Leave a comment